
Rouan Mathias, Gourmelon Françoise
CNRS UMR LETG, Institut Universitaire Européen de la Mer, rue Dumont d’Urville, 29280 Plouzané cedex, France
Esta dirección de correo electrónico está siendo protegida contra los robots de spam. Necesita tener JavaScript habilitado para poder verlo., Esta dirección de correo electrónico está siendo protegida contra los robots de spam. Necesita tener JavaScript habilitado para poder verlo.
Origin and context
The LETG (http://letg.cnrs.fr) research lab holds a unique position in the scientific landscape of Western France. Not only is it involved in three Earth Science and Astronomy Observatories (in Brest (http://www-iuem.univ-brest.fr/observatoire), Rennes (https://osur.univ-rennes1.fr/) and Nantes (http://www.osuna.univ-nantes.fr/), but also in several national systems for observing the environment (the Zones Ateliers network coordinated by the CNRS; (http://www-iuem.univ-brest.fr/zabri/fr) and Dynalit (http://www.dynalit.fr/fr), the national coastline dynamics observation system). LETG is an environmental geography laboratory that has been developing geomatics expertise for several years now. Right from the early 2000s, it promoted a knowledge engineering approach resulting in the creation of several data catalogues dedicated to the coastal environment. Drawing on this experience, in 2011, the lab designed a joint SDI with the observatories falling within the scope of the project. The aim was to meet the needs of both the laboratory and the Earth Science and Astronomy Observatories in terms of storage, documentation and readily-available data, (primarily geographic and time series) from coastal environment observation.
Services and Technologies
A website (http://indigeo.fr) provides users with a single point of access to Indigeo and the different services offered (metadata catalogue, viewer and OGC web services, Open Geospatial Consortium: http://www.opengeospatial.org/) along with a data entry and publishing guide. The software solution used is geOrchestra (http://www.georchestra.org/). This is an open, interoperable and modular software suite created in 2009 in response to the INSPIRE directive. The success of this solution can be measured by its use. Around twenty different general SDIs use it on a varying scale ranging from national (http://geo.gob.bo/) to local (http://www.data.rennes-metropole.fr/les-donnees/catalogue/). This software suite consists of independent and interoperable modules used to build a customised infrastructure. Three geOrchestra 14.01 modules were installed for Indigeo: a metadata catalogue (geoNetwork), a geo-referenced data server (geoServer) and an advanced map viewer (mapfishapp). Several additional services and tools were developed to meet the needs expressed by scientists. These concern centralised authentication (geoAuth), the generation of dynamic graphics and an intuitive and scalable viewer (geoCMS) enabling, among other aspects, the temporal dimension of certain data to be taken into account. CMS or Content Management System is a term generally used to describe systems used to update websites dynamically.
The metadata catalogue (geoNetwork). Metadata is managed using geoNetwork, a web application developed and updated by an active community which ensures the metadata is made available in standardised and interoperable format. A training session on producing metadata involving fifteen or so geographers and using a test version of Indigeo revealed the complexity of the standard. This led to the creation of simplified metadata models adapted to the main types of geographic information and a data entry guide.
The geo-referenced data server (geoServer). The managed data consists mainly of layers of geographical information in vector format and remote sensing images. The geoServer application enables this data to be stored and shared across data warehouses. Users access data via standardised and interoperable web services that enable available information to be displayed and/or downloaded directly via Indigeo and/or a GIS client (QGIS, ArcGIS®ESRI). geoServer can not only be used to manage access rights to each data warehouse to respect the private or public nature of data, but also to integrate spatial reference databases such as PostGIS, which is highly useful for providing dynamic access to spatio-temporal datasets.
The advanced map viewer (Mapfishapp), supplied with the geOrchestra suite, is similar to a GIS-type application accessed via a web browser. In terms of user-friendliness, it is suited to expert users and offers functions such as the ability to view information layers (OGC flow or files), modify the symbology, submit attribute or spatial queries, export results, edit data and analyse it by incorporating additional modules, and also create maps.
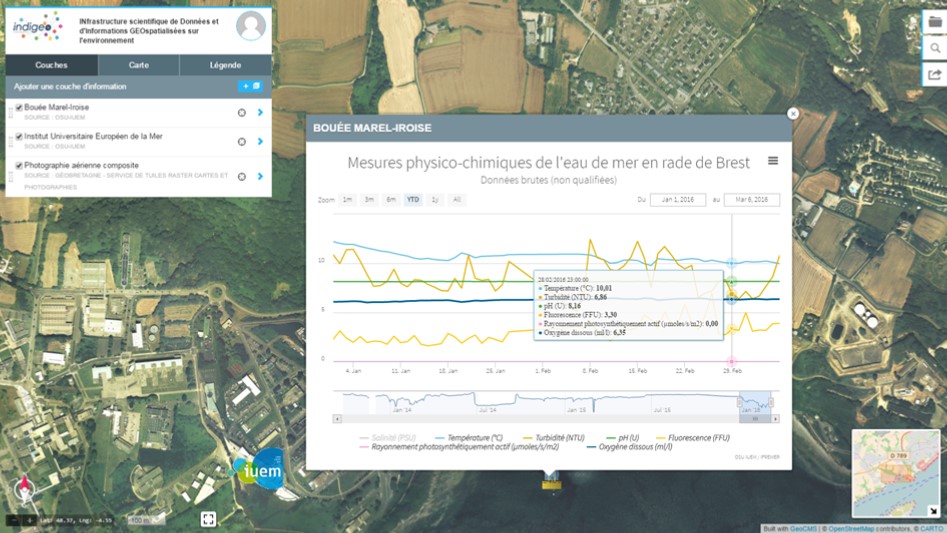
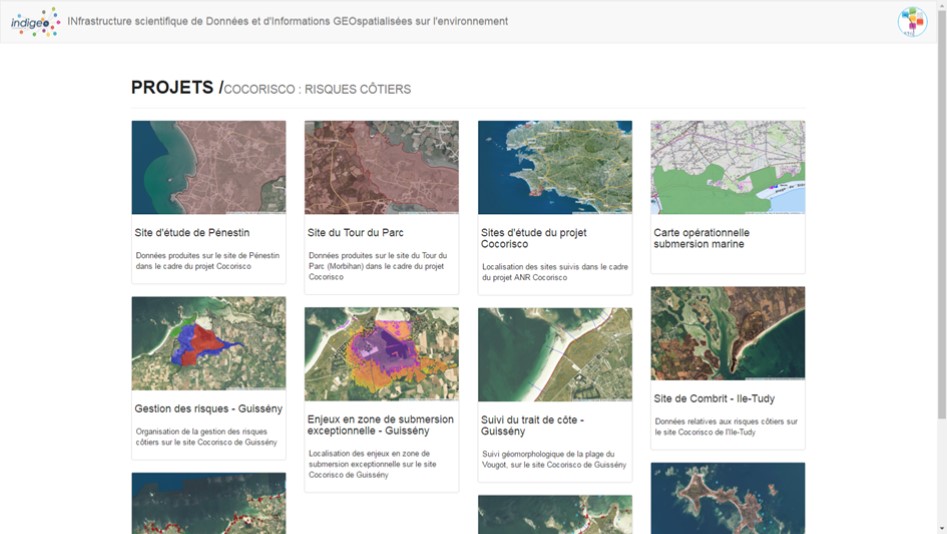
The ‘discover and use’ viewer (geoCMS). This viewer is based on relatively recent technologies (Ruby on Rails, AngularJS and the Leaflet.js library) which improve user-friendliness and offer the possibility of finding and using spatial data (spatio-temporal browsing, graphics viewing and a project approach). On the one hand, this viewer enables information layers to be organised into a catalogue that is managed via an interface reserved for portal administrators (the back end) and, on the other hand, it also allows the content of the data (attribute table or value) to be presented in a customised tooltip displayed when a layer is queried. This customisation is managed using a WYSIWYG editor in the management interface. It enables information to be made accessible to all by adding formatted texts, images, documents or web applications (e.g. dynamic graphics, Fig. 1). geoCMS also automatically identifies spatio-temporal datasets and enables users to browse through this type of dataset by generating a cursor adapted to the time frame (Fig. 2). Lastly, geoCMS has a function enabling users to save maps in folders and organise information layers into coherent groups according to different criteria (e.g. by scientific project or plan) (Fig. 3). Users can easily add these maps into web pages (websites, online articles, blogs, etc.).
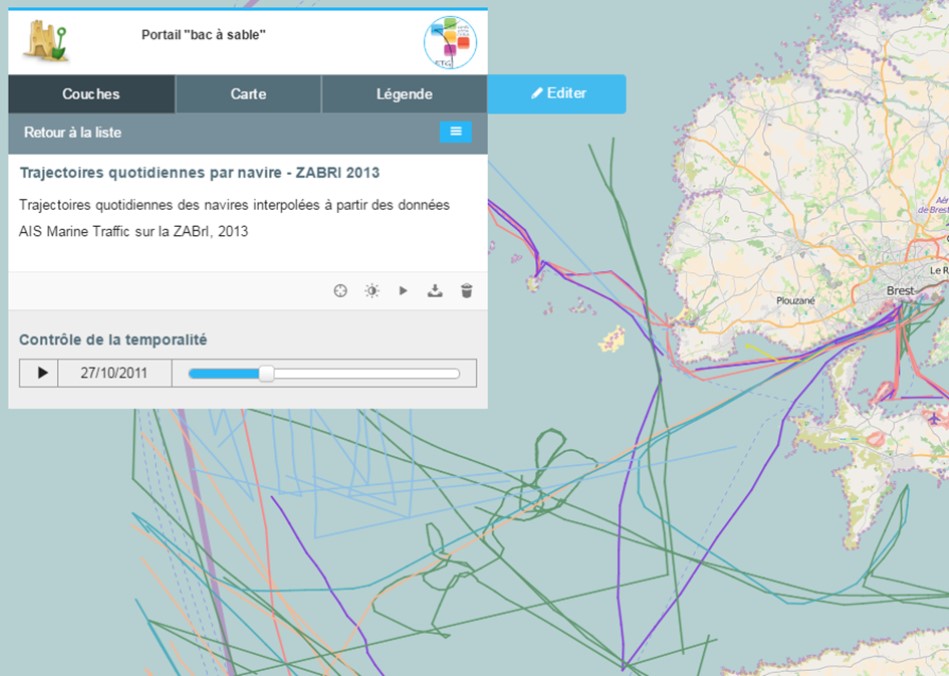
Figure 2. Spatio-temporal browsing through the information layer on vessel pathways in the ‘Zone Atelier Brest-Iroise’ area (AIS data, source: Marine Traffic 2013)
Standards
Indigeo adheres to several standards:
- For describing and searching for metadata (INSPIRE Discovery Services), the international ISO 19115 standard on defining metadata for geographic information as well as the ISO 19110 standard on feature cataloguing (attribute tables) and the ISO 19139 standard on describing XML implementation schemas.
- For querying and harvesting metadata, the Catalogue Service for the Web (CSW) standard.
- For viewing data (INSPIRE View Service), the OGC standard, but also, and above all, the Web Map Service (WMS) standard.
- For downloading data (INSPIRE Download Service), the OGC Web Feature Service (WFS) standard for vector data and the Web Coverage Service (WCS) standard for raster data.
Human resources and communities
In terms of human resources, Indigeo is currently supported by a local technical team (five cartographers, three data administrators, two system administrators and the service provider) which is in contact with other technical teams involved in setting up scientific SDIs in Western France. Indigeo users include producers of spatial information (42 producers from 13 environmental science laboratories), and other users who, in some cases, may also be producers. A total of 5,500 visits to the http://indigeo.fr website was recorded between June 2013 and 6 April 2016. This website provides users with a single point of access to the SDI’s tools, viewers, catalogue and web services.
Spatial information
Indigeo currently provides access to 534 metadata files, 551 information layers (vector and raster) and seven time series sourced from databases (Table 1). All catalogued data is open access and 83% of the information content comes from one laboratory (LETG). The rest is produced by other laboratories related to different observatories.
In addition to the data stored in it, Indigeo provides viewing access to more than 6,500 information layers thanks to the harvesting of fifteen or so French thematic or general SDIs.
|
Table 1. Types, formats and quantity of data units made available |
||
Vector |
Raster |
Database |
| Shape: 289 | ImageMosaic: 140 | PostgreSQL: 6 |
| PostGIS: 15 | Geotiff: 93 | MySQL: 1 |
| Arcgrid: 67 | ||
| ECW: 1 | ||
Development perspectives
In terms of development, several projects are currently underway including the desire to further improve interoperability with the OGC standardisation of time series and sensor data (Sensor Observation Service) as well as online data processing (Web Processing Service).
Additionally, to make accessing the different services offered by the SDI easier, authentication via the RENATER education-research identity federation is about to go into service. Lastly, the option of adding trackers to collect statistics about visits to the website is currently under consideration.
Conclusion
Indigeo has been up and running since 2013. The first version benefited from the geOrchestra software suite and geoCMS’s advanced functions. The iterative approach taken led to a platform that offered a broad range of services, but was not necessarily very user friendly (in terms of viewing or entering data into the catalogue). For example, thematic portals generated by geoCMS made both browsing through and managing data more complicated. This function was subsequently removed in the second version of Indigeo which put an emphasis on simplicity and took a user-centric approach to browsing. The aim was to encourage consumers of spatial information to move towards becoming ‘producers’ (Budhathoki et al 2008). However, the profile of Indigeo contributors has been relatively consistent since the beginning. Users adding to the catalogue have mainly consisted of a small group of geographers with knowledge in the field of GIS. Nevertheless, generating standardised metadata is still regarded as too complex, even for this well-informed public. This largely explains why there is such a low number of producers from other disciplines who are unfamiliar with the field. This small number is also probably due to the tool’s ‘laboratory’ origins. For reasons linked to presenting and exploiting data, it seems logical that developing interoperable SDIs at different academic levels would be the right solution. It would encourage the public concerned to appropriate SDIs and break down some of the power-based barriers within the scientific realm.
References
- Budhathoki N., Bruce B., Nedovic-Budic Z., 2008. Reconceptualizing the role of the user of spatial data infrastucture. GeoJournal, 72(3), p. 149-160