
Jeff Herter
Esta dirección de correo electrónico está siendo protegida contra los robots de spam. Necesita tener JavaScript habilitado para poder verlo.
New Yorkers rely on the New York Department of State Office of Planning, Development and Community Infrastructure’s Geographic Information Gateway (Gateway) every day to answer important questions. The Gateway provides answers to questions on habitats and environments, specific regulatory boundaries, coastal risk areas, and planning changes to local communities. All programs within the Office use the Gateway in their day to day operations from locating projects in relation to the State’s Coastal Area Boundary and significant coastal fish and wildlife habitat areas by Consistency staff to Brownfield Opportunity and Downtown Revitalization Initiative areas and Local Waterfront Revitalization planning efforts.The federally mandated Coastal Atlas is built on the Gateway and is used by homeowners and marine contractors alike as they prepare project submissions for consistency review. For those in local government or sister state agencies, the Gateway facilitates important decision-making by presenting relevant jurisdictional boundaries, providing information on grants possibilities, delineating areas of significant coastal fish and wildlife habitat, and illustrating climate change issues.
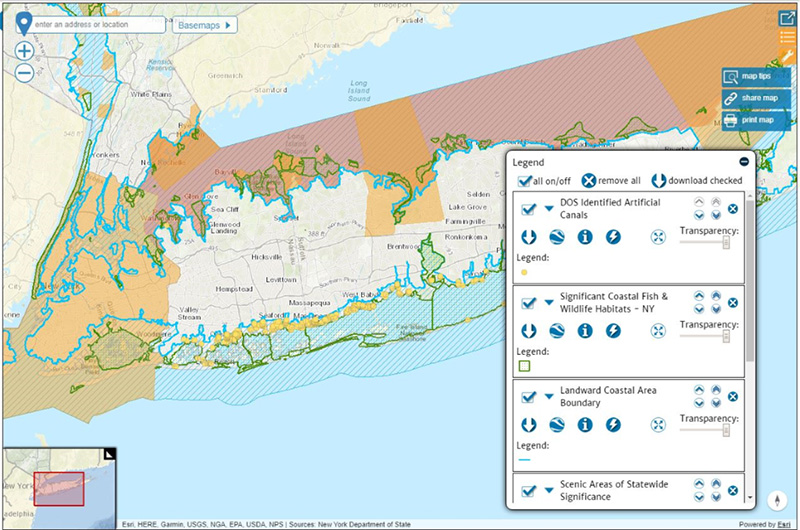
Figure 1: Example of a Coastal Map of Long Island, NY from the Gateway
 Survey
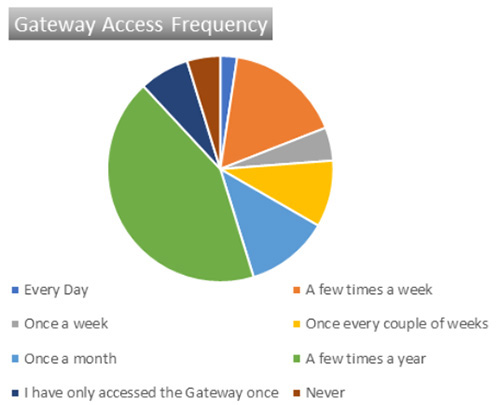
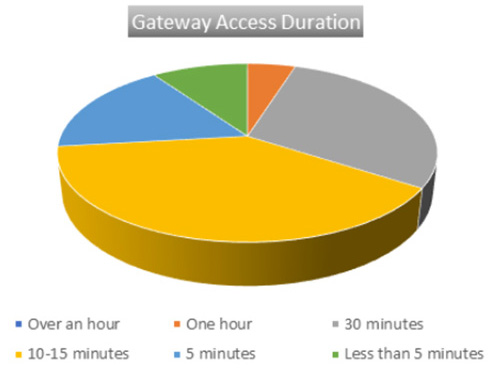
In September the Gateway team developed and conducted a short survey to get a sense of who is using the Gateway and glean some stories about how they are using it. Here is some of what we found out: 68 % of respondents worked for state government and 12% for local governments, counties, cities, towns and villages. Non-governmental organizations and those identifying as academic users each represented 5% of respondents and the general public only made up for 2%. This result really helped us understand that we had some real outreach work to do with regard to our target audience, local government and the general public. Users showed pretty broad interest regionally, with two data areas really standing out Great Lakes and Local Waterfront Revitalization Program data. All other data areas, Atlantic Ocean, Long Island Sound, Long Island South Shore Estuary Reserve and the Mohawk River Watershed had at least 25% of respondents showing interest. Over 1/3rd of respondents use the Gateway between 1 – 10 times a month and 41% use it a few times a year. And a few more numbers: Over half of the respondents feel the Gateway provides an easy intuitive experience; 61% said they would recommend the Gateway to their peers and co-workers; over 2/3rds, 68%, felt the Gateway provides information specific to their geographic area of interest, and finally, the average of respondents value for the Gateway was about $4000 per year (it’s free and will stay that way!)
Stories
Some of the stories we heard about how folks are using the Gateway:
- The Gateway is being used to access the New York Department of State risk areas for resilience planning and by State contractors and Lake Ontario communities engaged in the Lake Ontario Resiliency and Economic Development Initiative (REDI) through a REDI Mapper.
- Agencies and stakeholders involved in the Governor’s Office’s Environmental Justice and Just Change Working Group use a saved bookmark of the Gateway viewer to visualize potential Environmental Justice indicators.
- Educators and academics use the Gateway regularly as an in-depth learning opportunity and endless data source for a variety of topics, from high school geology students learning about deep-sea bathymetry to graduate-level marine biology researchers investigating fish and bird migration patterns.
- We heard from one private sector user, who provides software to State election boards, that relies on the Gateway for resolving redistricting disputes and would have to pay a corporate entity for data if the Gateway was not available.
- Other private sector businesses have told us that the Gateway offers an invaluable tool for revealing coastal zone management reviews, performing GIS analysis for clients, and providing mapping reference for geocoding projects.
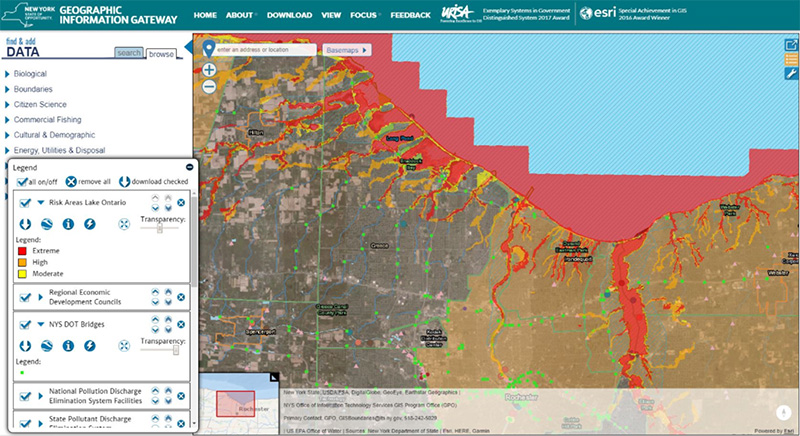
Figure 2: Example from Resiliency and Economic Development Initiative (REDI) mapper for Lake Ontario near Rochester, NY
Across the state, individuals access the Gateway when their need for information cannot wait. The Gateway’s availability as a real-time resource for latest conditions on tides, currents and recreational hotspots is integral to decision making for hundreds of visitors, from New York and all over the world. The Gateway’s “Story-Mapping” feature facilitates engagement with the Atlantic Ocean and climate change topics, providing stories of resilience and mitigation and highlighting the important work of the DOS Office of Planning and Development.
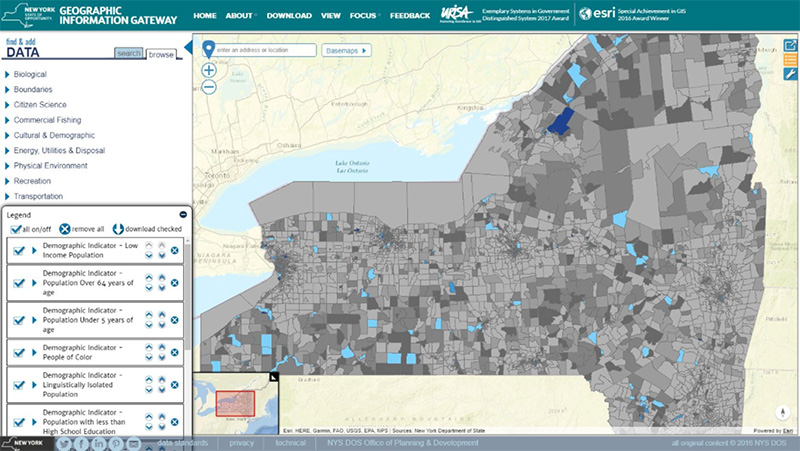
Figure 3: Example from the Environmental Justice visualization
The latest iteration of the Gateway has been met with consistent praise. The experience of browsing today’s Gateway is easy and intuitive, a unique feature for a deeply data-rich interface. The value of this ease of use cannot be understated, as a tool that is highly effective but difficult to use for much of its audience becomes immaterial. As the Gateway improves and grows, it continues to replace older and less engaging data sources, builds on ease of use and expands functionality. The Gateway is a platform for all New Yorkers and beyond, from every corner of the state, every professional sector and every background.
Traffic
Over the past 4 years we’ve had visitors from 105 countries outside the U.S., 54% of the countries in the world today. All 50 states and 3 U.S. territories have visited the Gateway and on average we get visits from 28 states outside of New York and 14 countries every month. The Gateway has exceeded 60,000 unique visitors since its launch. There have been over a quarter million pageviews, over three quarters of a million actions, and over 300,000 minutes or 5100 hours spent on the Gateway. On average we receive over 1220 visits and just over 5300 pages views a month. As the Gateway grows and improves, it will become more and more integral to planning efforts, day to day work flows and information dissemination.
Resources
- Access the New York Geographic Information Gateway at http://opdgig.dos.ny.gov/index.html#/home