
Terry Curran, P.Eng.
Introduction
In 2012, Dr. Isobel Pearsall convinced the non-profit Pacific Salmon Foundation (PSF) management that the organization needed a one-stop location of marine information for the Strait of Georgia, on Canada’s west coast. This was needed to support policy and decision making by PSF and others. Furthermore, many researchers were retiring, and there were lots of data in reports that did not have previous wide circulation, and were in danger of being lost. To that end, a Strait of Georgia Data Centre website was created (http://sogDataCentre.ca ), albeit without data.
Isobel knew I was retiring from the federal Fisheries and Oceans in early 2013, and that I had experience in documenting datasets. So, the data portion of the Strait of Georgia Data Centre was begun.
Starting to document metadata
We first did a user survey. Two important results were obtained. The first was the need for such a repository (Figure 1), and the second was the type of content desired (Figure 2). In terms of the desired data portal, a significant number of users wanted the larger Salish Sea, which is a cross-border interconnected waterway of the Strait of Georgia, Juan de Fuca Strait and Puget Sound.
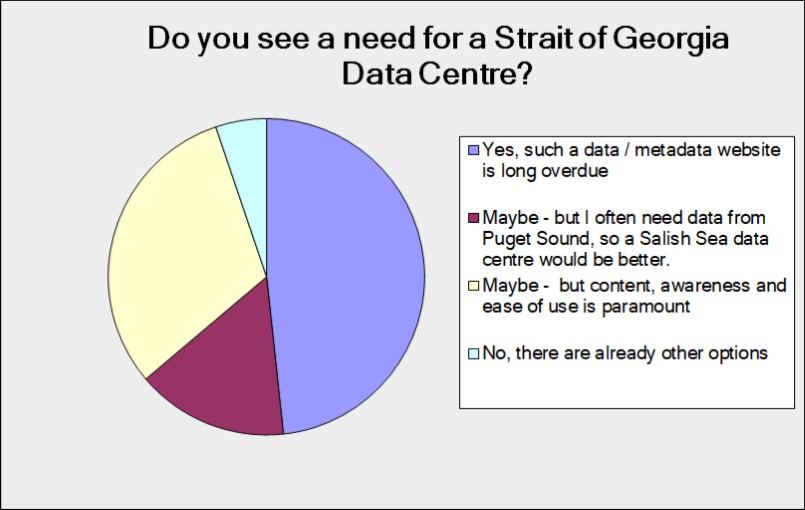
Figure 1: Results of the user survey on the need for the Strait of Georgia Data Centre.
We discovered that users wanted access to the large federal scientific datasets, initially for physical parameters (water properties and bathymetry) but also the fishery catch information. We also discovered there were two clusters of users – those that wanted the data (“modellers”) and those that wanted data layers (“mappers”). Coincidentally at this time, Canada was joining other major nations to sign onto the Open Data policy. Prior to that signing, with a few exceptions Canada did not have a culture of automatically releasing data, and data was often either unavailable, or available for a price. The Open Data Policy in 2013 began to make public service data more available, and that trend continues to this day.

Figure 2: Results of the user survey on the type of content wanted in the Strait of Georgia Data Centre
It was known that a collaborative project titled the British Columbia Marine Conservation Analysis Project (BCMCA) had occurred from 2007 to 2012. It had pulled together data from the federal Department of Fisheries and Oceans, Environment Canada, the Province of BC, and many other sources to document many of the marine resources for BC. The process included extensive peer-reviewed datasets organized as data layers, and thus the result was highly regarded. The project was no longer funded, and some of these layers were publicly available. We started with that as a basis, and updated the metadata to the ISO-19115 standard.
Summer of 2013
In the summer of 2013, two important events occurred. The first was becoming aware of ICAN 6, which just happened to be occurring at the local university. Not entirely certain that I should be attending, I did. It was a revelation! I discovered that what the PSF were really doing was building a coastal atlas. I discovered that groups around the world had done similar things and were significantly further along the learning curve than us. I discovered it was important to design data systems so that sharing was integral. And most importantly, I was made welcome by the international attendees.
The second important event in the summer of 2013 occurred when I said “okay – I have successfully converted the BCMCA metadata records to the ISO format, now where do I put them?” “Over to you” I was told. Gulp! After a bit, a virtual server at the University of British Columbia was made available. Then it was explained that it was in CentOS Linux, which meant it had no graphical user interface. At this point, I had no knowledge of Linux. Furthermore, we were told that one accessed the computer remotely using SSH, of which I had no knowledge. A pretty steep learning curve followed! Needless to say, the problems were eventually successfully resolved.
Resulting System Design
We were faced with the choice between commercial or Open Source hosting solutions. At the time we concluded that Open Source was the best approach. After four years, I think it probably was the best choice for our situation because of implementation flexibility, but now I also believe it is a matter of choice and not of cost. For many situations, especially when technical support is limited, a full-service commercial solution may be the best choice.
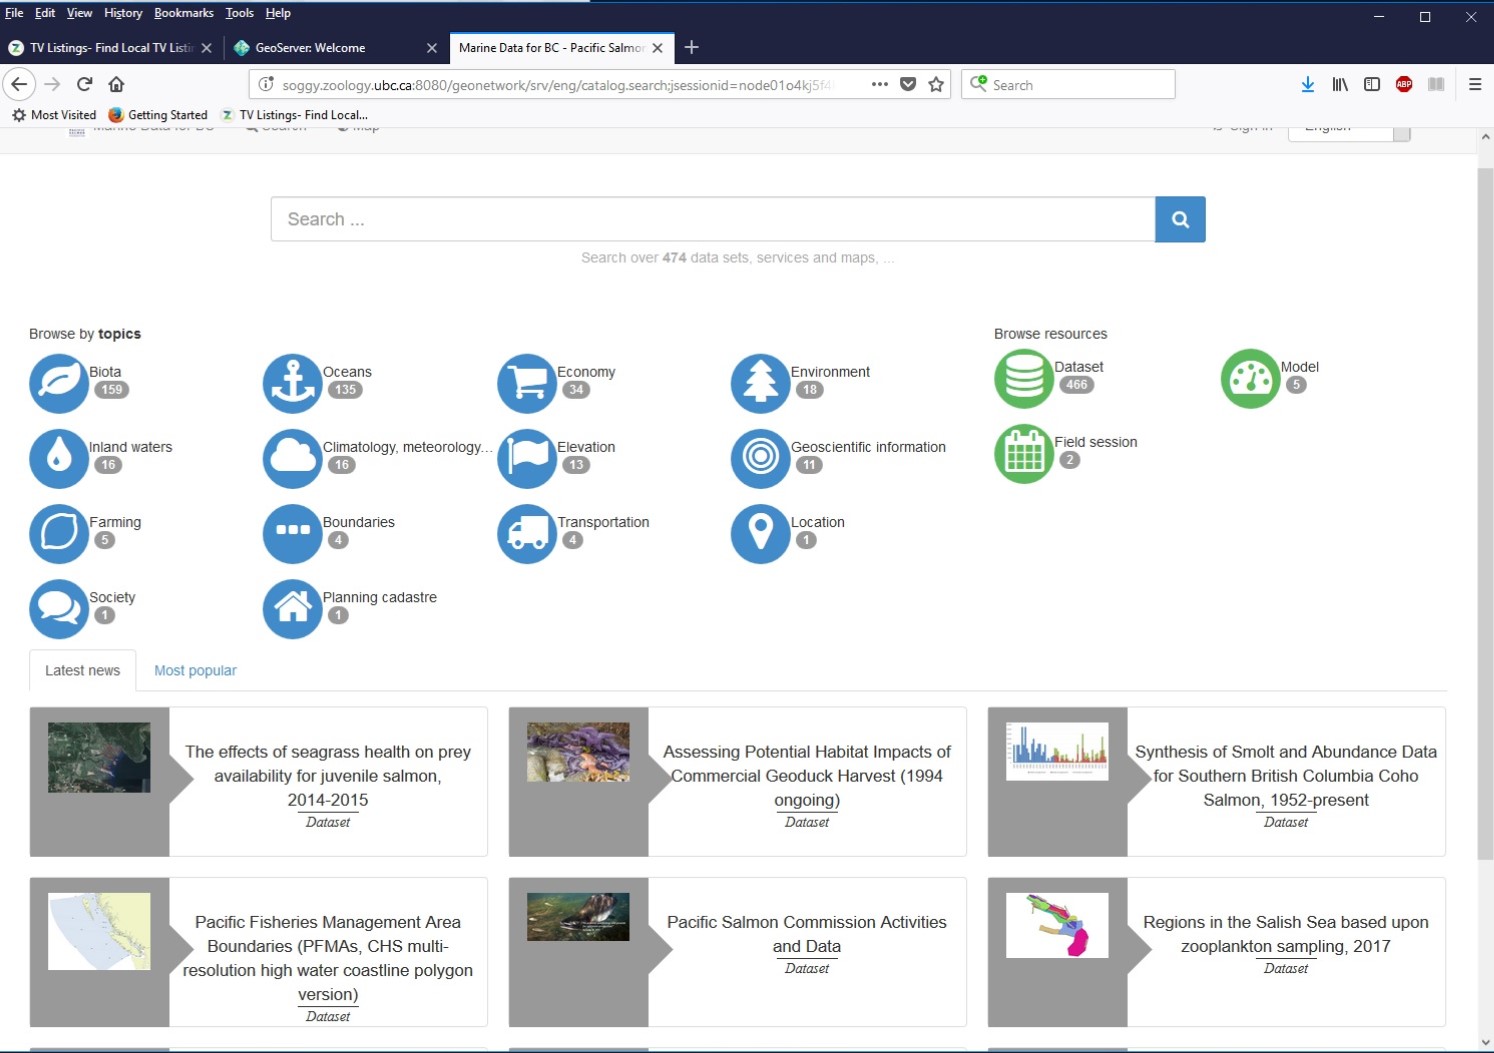
Figure 3: Main screen of the GeoNetwork implementation of the Strait of Georgia Data Centre
Our data system currently uses GeoNetwork as the main hub for metadata, data and documents, and links to GeoServer. We use Jetty, because a brief test indicated it was slightly faster than Tomcat. We install the data applications independently. Both applications use PostgreSQL with the PostGIS spatial extension. We tried and have used the SOLR search engine, but we do not use it routinely.
The metadata
As mentioned, the metadata is exclusively ISO-19115/19139 compliant. Although other standards can be supported in GeoNetwork, we have restricted the choice. We always include a representative thumbnail image.
Our first choice is to link the metadata to a site with the data if available. Because we are trying to simultaneously satisfy the modellers and mappers, often we need to have a local copy. Another reason to link to other websites is to give credit to the original data providers.
We normally use three official thesauri for metadata keywords. One thesaurus is the DFO place names for Canada. The other two thesauri are for theme keywords: the Global Change Master Directory, and the Government of Canada. GeoNetwork searches search to whole metadata record, so we don’t believe these keywords add much, but we do it anyway.
To create the initial draft of the metadata, we use a free application called jNAP (it has some other names as well). It makes metadata creation very easy, and numerous summer students have quickly learned to use the application. The “j” implies it is written in Java, and the “NAP” means it implements the North American Profile. The NAP closely follows the ISO standard, with only a few restrictions. It can accommodate other international thesauri and other profiles.
To validate the metadata before uploading, we use Kernow / Saxon. jNAP also can validate the records.
Finally, we upload the metadata record with accompanying files to GeoNetwork (http://soggy.zoology.ubc.ca:8080/geonetwork ). We use the GeoNetwork editor to perform a final validation, and to add the links to external websites, local data, GeoServer links, and the thumbnails.
We currently have about 500 layers, but we do not consider this a useful indicator. We have chosen to have larger chunks of data, whereas we easily could have made many more records that describe smaller datasets.
Dealing with the PostgreSQL database
We use the PostgreSQL database cluster for metadata and databases. The virtual machine at the University of BC is in a very secure environment. One consequence is that the normal graphical user interface used to interface to PostgreSQL (pgAdmin3) cannot be used, and everything is by command line instructions.
We normally receive data as shapefiles or as comma-separated value data. The shapefiles are fairly easy to handle. To create database tables for the CSV data, we use a spreadsheet application like Excel to create the column headings and expected format. We than load the data, and then add indices for speed.
We use several databases for the various sources of data, simply for easy administration.
Our experience with PostgreSQL has been excellent. We have never had a problem.
GeoServer for data layers
Creating the data layers in GeoServer (http://soggy.zoology.ubc.ca:8080/geoserver ) has been equally straightforward. On input, it has excellent flexibility in accepting raster and vector data. On output it handles the re-projection and re-formatting.
We make the layers available as WMS (data images; http://soggy.zoology.ubc.ca:8080/geoserver/wms ), as well as WFS (actual data; http://soggy.zoology.ubc.ca:8080/geoserver/wfs ) if the layer is so suited.
Data sharing
The system has the capability to host both metadata and data layers, but can restrict access to specific users. This need could arise if there is a paper in progress, or some permissions have not been completely resolved but we do not want the data to be lost. We do not normally use this feature – our metadata and data is almost always open and downloadable by default. The metadata data can be easily harvested by other organizations.
Documenting the processes
There are many steps in the creation of a website, and too many to remember exactly. As a consequence, about twenty processes documenting the steps have been created, following the ISO-9000 format. A very good analogy is as recipes. For instance, sometimes there is more than one approach to a process that could be valid. In fact the ICAN Cookbooks were the initial motivation. It has been found that processes evolve over time, and it is easy to revise or even discard obsolete processes. The technical committee has placed a version of these on GitHub for download, but truthfully they are in need of a revision.
Ongoing efforts
A continuing issue in the marine environment is trying to understand how a 3D environment evolves over time. The PSF is working with the organization Long Live The Kings (LLTK, Seattle, WA) to understand the factors that have resulted in a dramatic decline in salmon survival since the early 1990s. To this end, ten citizen science groups each gather water column samples at ten locations throughout the Strait of Georgia twenty times a year from March to October. The resulting data is placed in the sogDataCentre. We are attempting to visualize this information through animation. It is a work in progress.
Another ongoing effort is data subsetting. Some of our datasets are extremely large (28 million records), and to satisfy the data users (the “modellers”), we have written an application to filter (subset) the data for a reasonable download package. This filtering normally includes latitude-longitude and date range, but datasets can be cumulatively filtered on any number of the variables. This is enabled on the website, but the initial load currently takes about twenty seconds.
A third effort is to formally join the ICAN network. This could be quite useful to our region, because many datasets were arbitrarily are the Canada-USA border, and the natural processes continue across borders. Not having complete knowledge of the Canada-USA coupled waterbodies inhibits understanding and policy making.
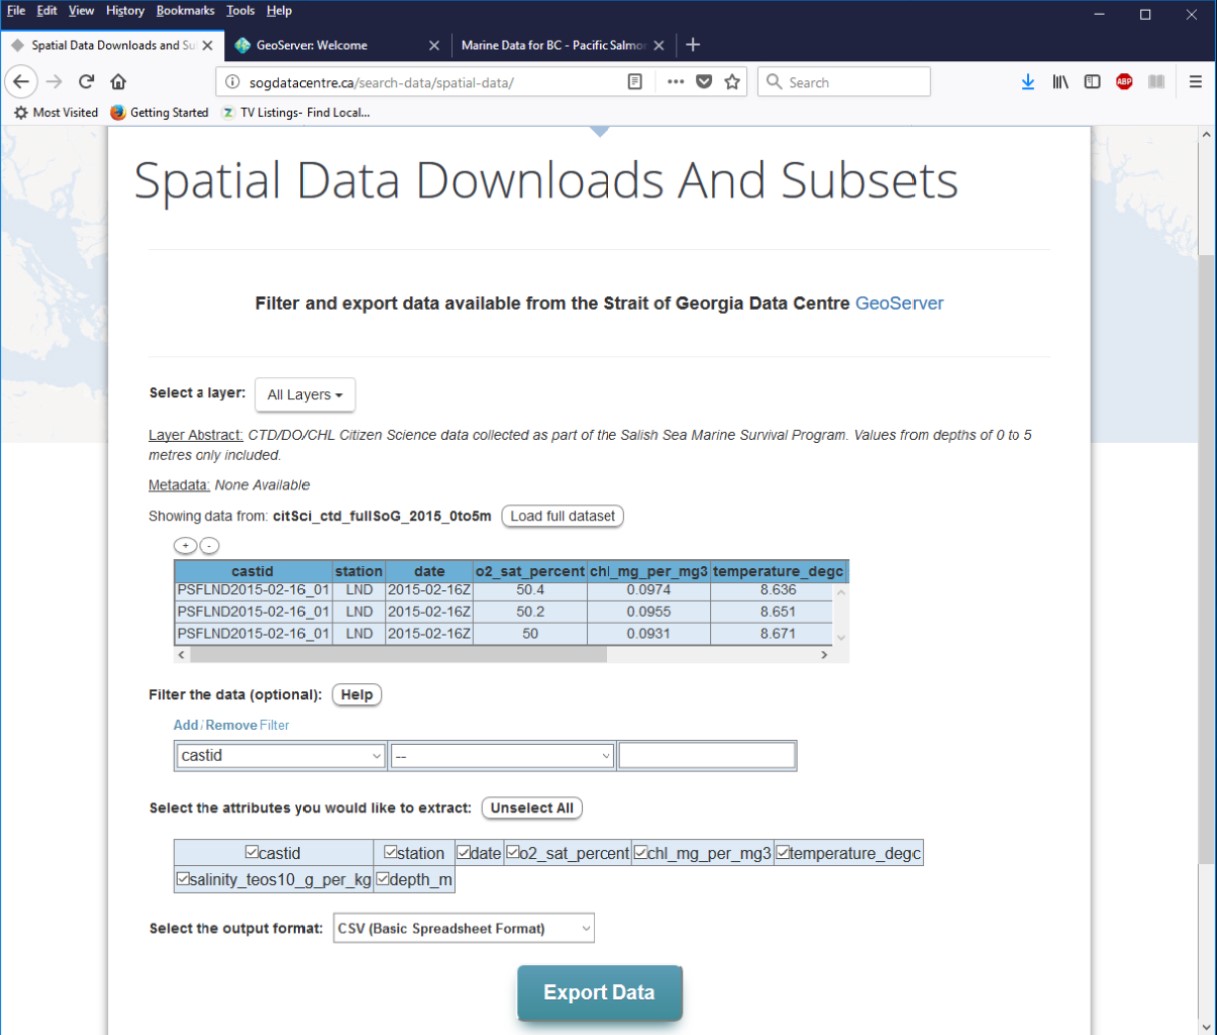
Figure 4: Example of the data subsetting feature of the Strait of Georgia Data Centre to reduce large data sets to a reasonable size for downloading
Summary
Serendipitously, the Pacific Salmon Foundation has created a coastal marine atlas of historical data for British Columbia. It is based upon Open Source applications, and both metadata and data is freely downloadable.
Acknowledgements
I am extremely thankful for the assistance of ICAN Technical Committee for guidance, and for the technical opportunity presented by the Pacific Salmon Foundation. Isobel Pearsall continues to guide the team. Nick Murray crated the main portion of the website. Richard Sullivan at UBC provided Linux guidance. Benjamin Skinner is responsible for the data subsetting and animation efforts. Many students have contributed to the project. Performing data discovery and rescue were Sarah Fraser, Jamie Hargreaves, Ianna Folks, Heather Wathen, and Charles-David Clayton. Tanya Haddad and the rest of the ICAN Technical Team encouraged and assisted in the development of the ICAN process documentation.