
Andy Sherin
Esta dirección de correo electrónico está siendo protegida contra los robots de spam. Necesita tener JavaScript habilitado para poder verlo.
Several on-line atlases have been developed that are relevant to the United Nations Sustainable Development Goals. Three are highlighted here. Please send examples of other SDG relevant atlases to Andy at Esta dirección de correo electrónico está siendo protegida contra los robots de spam. Necesita tener JavaScript habilitado para poder verlo. for future articles.
Protected Planet
SDG Goal 14.5
![]() SDG Goal 14.5 states “By 2020, conserve at least 10 percent of the coastal and marine areas, consistent with national and international law and based on the best available scientific information”.
SDG Goal 14.5 states “By 2020, conserve at least 10 percent of the coastal and marine areas, consistent with national and international law and based on the best available scientific information”.
Learn more about SDG 14 here
Protected Planet is a publically available online platform where users can discover terrestrial and marine protected areas, access related statistics and download data from the World Database on Protected Areas. It is updated monthly and is managed by the United Nations Environment World Conservation Monitoring Centre with support from IUCN and its World Commission on Protected Areas.
Protected Planet provides data in several formats, supports an API and an ESRI Map Service.
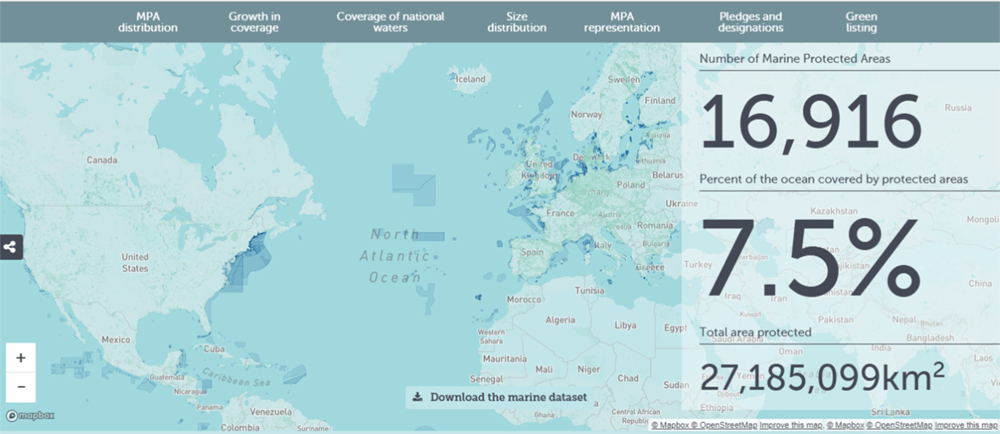
Figure 1: Sample map showing marine protected areas and statistics from the protectedplanet.net website
World Bank Atlas of Sustainable Development Goals
SDG Goal 14.3
![]() SDG Goal 14.3 states “Minimize and address the impacts of ocean acidification including through enhanced scientific cooperation at all levels”
SDG Goal 14.3 states “Minimize and address the impacts of ocean acidification including through enhanced scientific cooperation at all levels”
Learn more about SDG 14 here
The 2018 World Bank Atlas of Sustainable Development Goals has over 180 maps and charts showing the progress societies are making towards the 17 SDGs. The Atlas has annotated data visualizations, which can be reproducibly built form source code and data. The Atlas can be viewed online, download the PDF publication, and access the data and source code behind the figures.
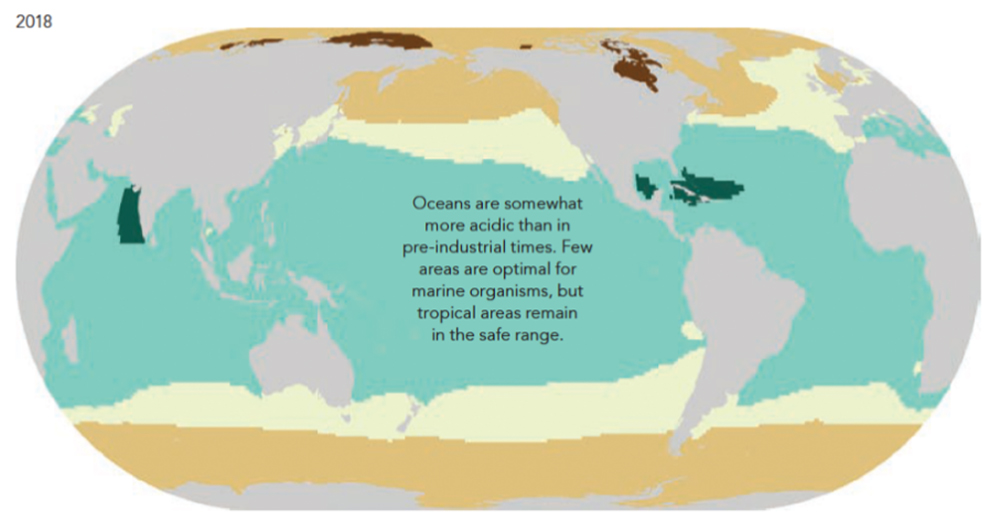
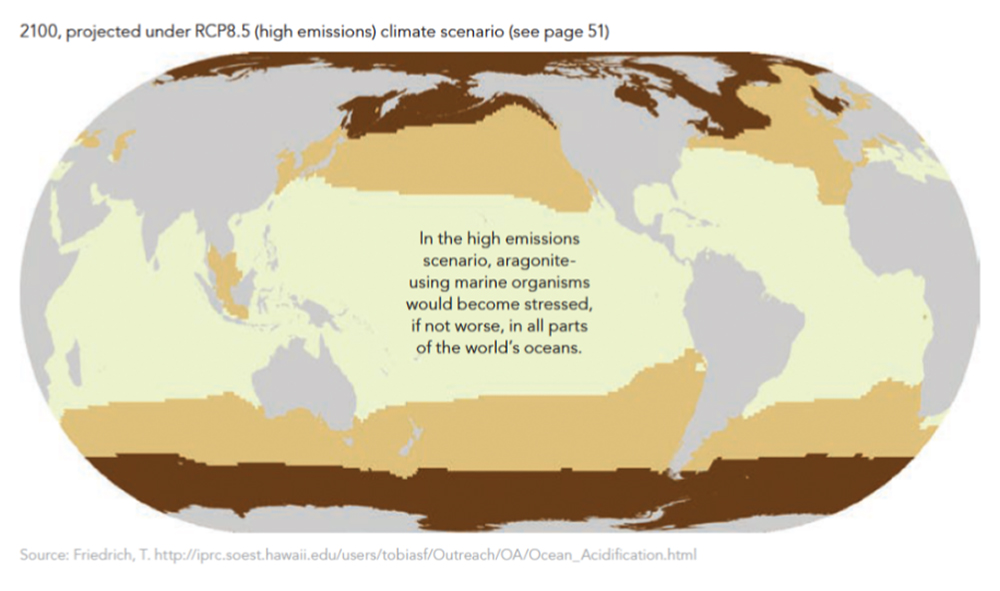
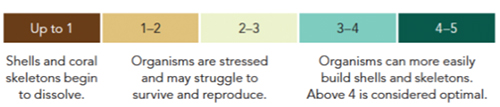
Figure 2: Maps of the impact of ocean acidification on organisms in 2018 and projected for 2100
in a high emission scenario from the 2018 World Bank Atlas of Sustainable Development Goals
Canadian Climate Atlas
SDG Goal 13.1
![]() SDG Goal 13.1 states “Strengthen resilience and adaptive capacity to climate related hazards and natural disasters in all countries”.
SDG Goal 13.1 states “Strengthen resilience and adaptive capacity to climate related hazards and natural disasters in all countries”.
Learn more about SDG 13 here
Environment and Climate Change Canada has released the climateatlas.ca that allows the user to interactively compare present conditions to future conditions for several significant climate parameters. The atlas doesn`t yet show ocean related parameters. Hopefully that will change in the near future. Shown in Figure 3 are two maps showing the present day frequency of very hot days (> 30 ° ) in Canada compared to predictions for the period 2051-2080 for a high GHG emissions scenario.
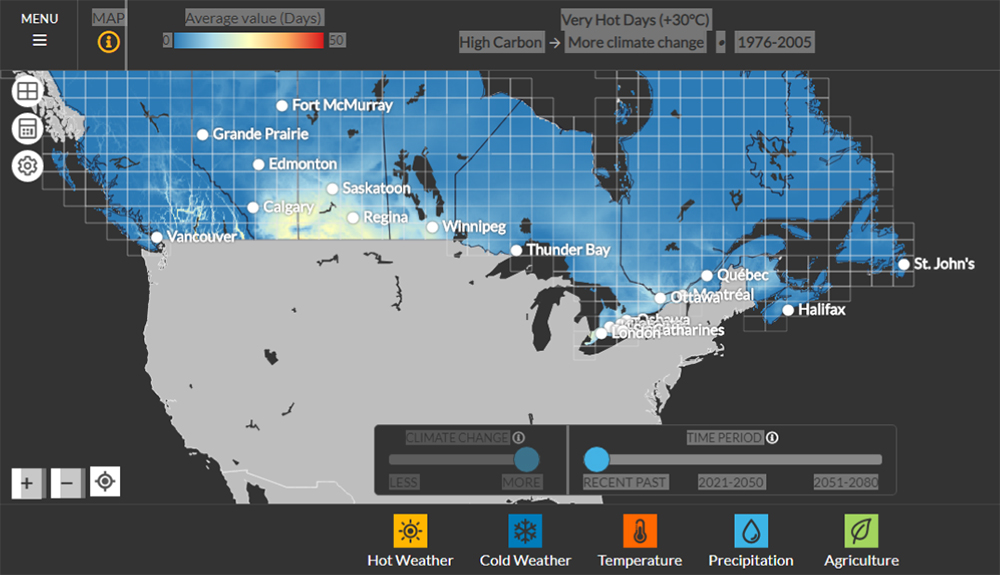
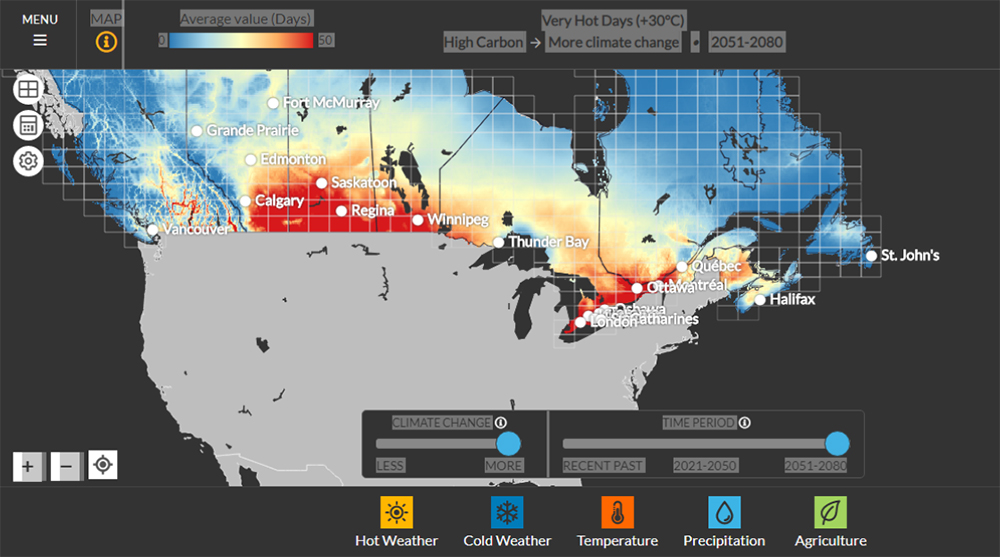
Figure3: Example map from Canada’s Climate Atlas website showing predicted differences between present day frequency of very hot days (top) and the frequency of very hot days in the period 2051-2080 assuming a high GHG emission scenario