
Small but complex: an atlas for the Belgian coast
- Detalles
- Publicado: 10 Septiembre 2012 10 Septiembre 2012
Kathy Belpaeme
Coordination Centre, ICZM
Esta dirección de correo electrónico está siendo protegida contra los robots de spam. Necesita tener JavaScript habilitado para poder verlo.
Figure 1: The cover of the 2nd edition of the Belgian coastal atlas
With its 67 km, the Belgian coast seems tiny compared to the neighbouring countries. Its importance and complexity is, however, not less important. Mapping all the uses and users in an atlas proved very helpful, both for the stakeholders and the general public to understand the need for a coordinated management.
The Belgian coastal atlas was first published in book format in 2004, and updated in 2011. The online version was launched in 2005, and revised thoroughly in 2011 and is available in four languages.
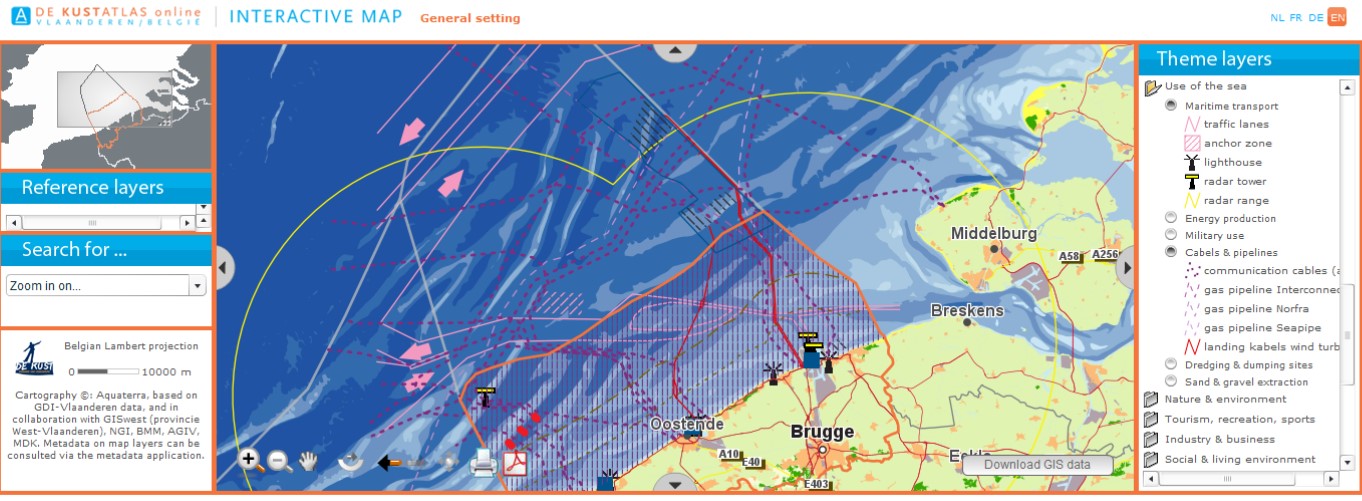
The atlas is appreciated as a portal for the Belgian coast and sea, supporting the ICZM process for a wide range of coastal actors, planners and managers. It provides core information through an interactive website, to help local citizens, stakeholders and policy makers make better decisions or gain a better understanding of the coast. Great attention has been given to an attractive lay-out and the ease of navigating through the website. The information is thematically arranged in 13 chapters, taking the land-sea interface into consideration. Each chapter provides static, ready-to-use maps, coastal data and an interactive map. All static maps can be downloaded in PDF format; the data in excel format. The interactive map contains tools such as measuring, zooming, and printing. Furthermore, the sustainability indicators are integrated into the Coastal Atlas. Twenty-one indicators are grouped in seven chapters, giving an insight to the state of the coast and the sustainability of its development. Examples of indicators are: the age percentage of residents in the coastal communities, the extent of sea level rise or the amount of waste per household. Whenever possible, the indicators are visualised geographically on the interactive map, showing differences between the municipalities.
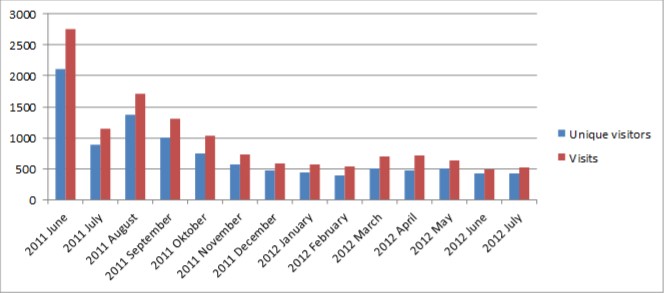
Since the launch of the second on-line atlas in June 2011, the web statistics tool used has changed. Consequently Web statistics before and after June 2011 cannot be compared. The figure shows the trend for the total number of visits and the number of unique visitors since the launch in June 2011 until website and why. The results of the poll showed that people mainly look for: general info on the coast, the interactive mapping tool and touristic information (= top 3), and that the profile of the visitors is very diverse. Clearly all different sorts of people find their way to the website. The book version of the Coastal Explorer has been officially launched on 1 September 2012. The launch was embedded in the three day workshop of ICAN, the International Coastal Atlas Network, taking advantage of the international scene of this conference.
It is crucial that the data of the atlas is kept up-to-date. Interaction with data holding and management authorities is very important in achieving this goal. A working group meets yearly to evaluate the atlas. Receiving feedback from the users is also very valuable to highlight any problems or needs.
DE KUSTATLAS online http://www.coastalatlas.be/en/