
Maryland’s Coastal Atlas Undergoes Face-lift and Rolls Out New Tools for Informing Coastal Planning and Decision-Making
- Detalles
- Publicado: 06 Marzo 2012 06 Marzo 2012
By Jeff Allenby and Chris Cortina
Maryland’s Chesapeake & Coastal Service (CCS) is improving the State’s ability to access coastal data and tools that will help inform decision-making about coastal management with Maryland’s Coastal Atlas. This online mapping and planning tool, developed to allow users to visually analyze and explore data for coastal and ocean planning activities, has recently undergone a number of exciting updates and enhancements that are slated for launch in March 2012.
 Originally launched in June of 2008, the Coastal Atlas represented a significant overhaul from the Maryland Shoreline Online mapping portal supported by the Department of Natural Resources’ Chesapeake & Coastal Service (CCS). Sparked by Governor O’Malley’s enthusiasm for GIS technology as a tool for improved transparency, accountability, and communication, the Coastal Atlas was developed shortly after the roll out of Maryland iMap – a centralized collection of the most commonly used Maryland data layers, tools and services hosted in an ESRI ArcGIS Server environment. Maryland iMap makes these layers, representing the best data available to the public for free, accessible as web services so state and local governments don’t have to store or host data while ensuring the layers look the same across all state mapping applications. Following the lead of the earliest Maryland iMap applications (like GreenPrint, AgPrint and StateStat), the Coastal Atlas was developed using ArcGIS Server and Adobe Flex technology allowing state and local officials to access the data/web services they want to display.
From October 2010 through March 2012, through funding from Maryland’s Coastal Zone Management grant and with the help of developers/programmers at Towson University’s Center for GIS and Maryland Environmental Service, CCS staff has worked to enhance the functionality and utility of the Coastal Atlas. A major overhaul to the Atlas’s three mapping applications (Ocean, Shorelines, and Estuaries) has allowed the addition of new tools that enhance the user experience and allow for easier modification to include future enhancements.
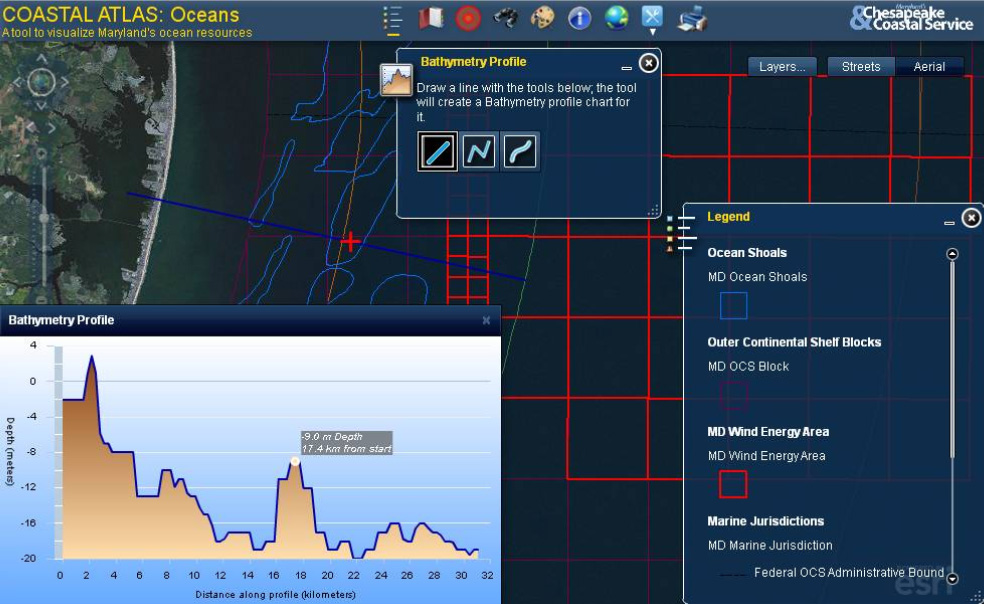
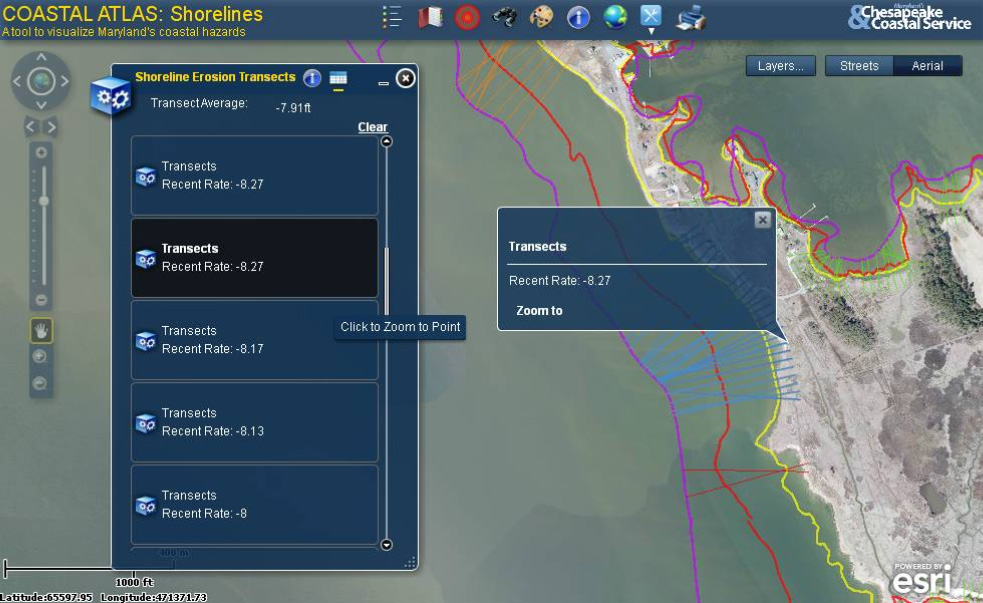
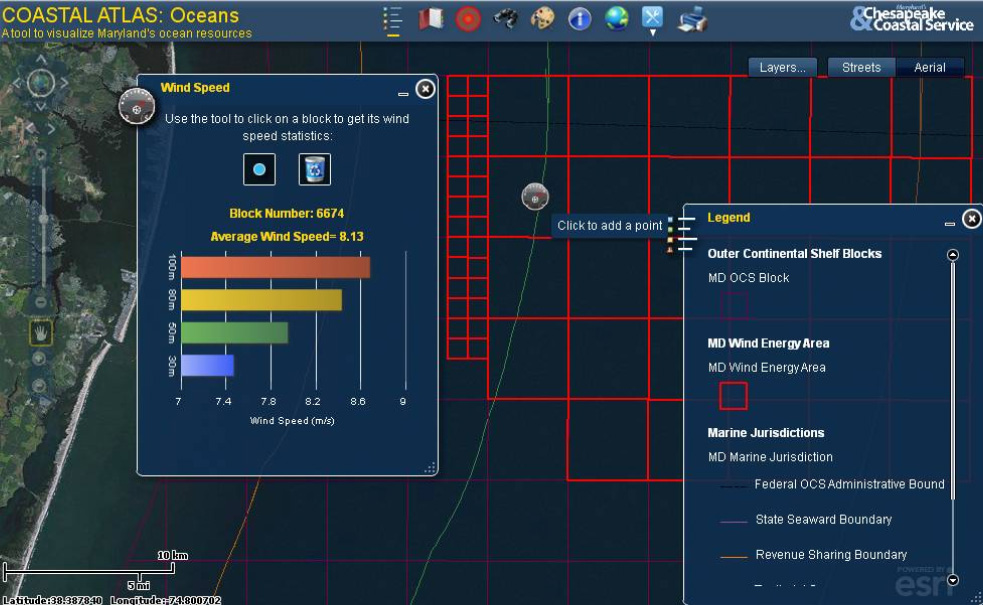 The most noticeable enhancements to the Coastal Atlas are to the overall look and feel. The Atlas applications were updated to the FlexViewer 2.5 template and a uniform user interface was created for all three applications (see photo). The new interface allows for better organization of tools and icons clearing up valuable map space, contributing to an overall better experience. Other enhancements worth highlighting include: the creation of the Add Mapservice widget, which allows users to import custom mapservices as well as import, from pre-defined lists, any layer from the other Atlas applications; addition of the eDraw widget (developed by Robert Scheitlin) allowing users to choose the size, color, font and emphasis of text labels for drawings as well as the ability to save and load these drawings for future sessions; a revamp of the existing Identify tool that allows the user to choose between identifying from all layers or from a specific layer - increasing the ability of the end-user to select only pertinent information while decreasing the “clutter” of the old Identify results; creation of a new CBNERR Sites widget to display location and links to basic information on Chesapeake Bay National Estuarine Research Reserve Sites; creation of a new CELCP widget to display location and basic information about sites acquired through the Coastal and Estuarine Land Conservation Program (property name, year established, acreage, project type); development of an “Offshore Wind Roses” widget which displays a small image of a wind rose diagram and link to larger image; and the adaptation of an “Elevation Profiles” widget (developed by Mark Deaton) that was modified to show bathymetric profiles along user selected paths of either a straight line, polyline, or freehand line.
 The remainder of the updates and enhancements were of the general housekeeping variety, taking advantage of the FlexViewer 2.5 template and new user interface to more intelligently organize tools, icons, and buttons in the available mapping space and to optimize the overall user experience. Examples include:
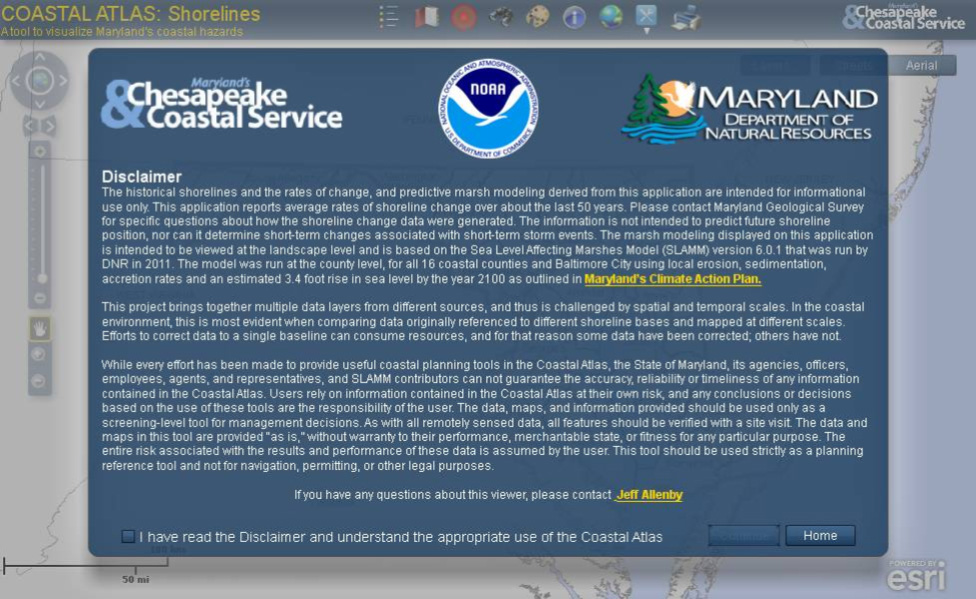
- Developed a Splash Screen to display disclaimer information when each mapper is opened;
- Removed the Layer List widget and replaced it with the “Layers…” button next to the Map Switcher. Also incorporated increased functionality to adjust layer transparency, move each layer forward or backward in the map, and access metadata;
- Created a consistent user interface for all three mappers where the widget icons are all the same, in the same location, with the same instructions;
- Placed all custom geoprocessing tools in a dropdown menu located in the widget tray to clean up the user interface as well as to allow for a consistent user experience between applications despite the geoprocessing widgets being unique to each mapper.
- Utilized the Export Map widget (developed by Robert Scheitlin) to replace the existing Print widget. This widget allows the user to export a map to .jpg file, which can be used in presentations or documents, instead of just printing it;
- Updated the “About” window to include information about our program and to include contact information and links to important websites; and
- Revised and created custom geoprocessing widgets that automatically turns a specific layer we wanted to highlight on and off when the widget is opened or closed and allows the user to view information about them.
 In addition to the Atlas face-lift, CCS has created a more comprehensive
For more information on Maryland’s Coastal Atlas visit http://dnr.maryland.gov/ccp/coastalatlas/index.asp or contact Jeff Allenby with Maryland’s Chesapeake & Coastal Service at Esta dirección de correo electrónico está siendo protegida contra los robots de spam. Necesita tener JavaScript habilitado para poder verlo.. Those interested in learning more about Maryland iMap and other mapping tools developed by the State should visit: http://www.imap.maryland.gov/portal/.