
Marine Atlas supports Belgium's Marine Spatial Plan
- Detalles
- Publicado: 01 Marzo 2016 01 Marzo 2016
Serge Scory, Mia Devolder, Nabil Youdjou & Laurence Vigin
Royal Belgian Institute of Natural Sciences, Biodiversity and Ecosystems Data and Information Centre
Esta dirección de correo electrónico está siendo protegida contra los robots de spam. Necesita tener JavaScript habilitado para poder verlo.
Introduction
The Belgian part of the North Sea is one of the most intensively used sea area in the world. Shipping, tourism, fisheries, sand exploitation, windmills…, all these activities make use of what the sea has to offer. However, this busyness causes high pressure. Several activities may be in each other’s hair and may also have an impact on the environment. In order to make this all balance, the Belgian Minister for the North Sea took the initiative to define a marine spatial plan. After months of intensive preparatory work, expert consultation and stakeholder participation, a Royal Decree “establishing the spatial use of the Belgian part of the North Sea” for the period 2014-2020, was published in March 2014.
The implementation of this plan is the mission of the federal ministry of the environment, in charge of the North Sea policy (Marine Environment service of the FPS “Health, Food Chain Safety and Environment”). The Royal Belgian Institute of Natural Sciences (RBINS), a federal scientific institution, provides scientific and technical support to the Marine Environment service. It is in this context that RBINS experts in geographical science and information technology offered to create a dedicated web portal for the Belgian marine geo–referenced information.
Objectives and specifications
The portal aims at:
- becoming a single stop shop for Belgian marine geo–referenced data,
- ensuring compliancy with applicable EU directives (e.g. the “INSPIRE” directive, the directive “establishing a framework for maritime spatial planning”),
- acting as online reference resource, both for national and international needs,
- addressing the needs of as many categories of users as possible.
The portal was built with the following specifications in mind:
- a clear and re–usable data processing workflow had to be established,
- a versatile IT architecture should be built,
- the portal should allow submission and/or publication of data and metadata by other administrations.
Implementation
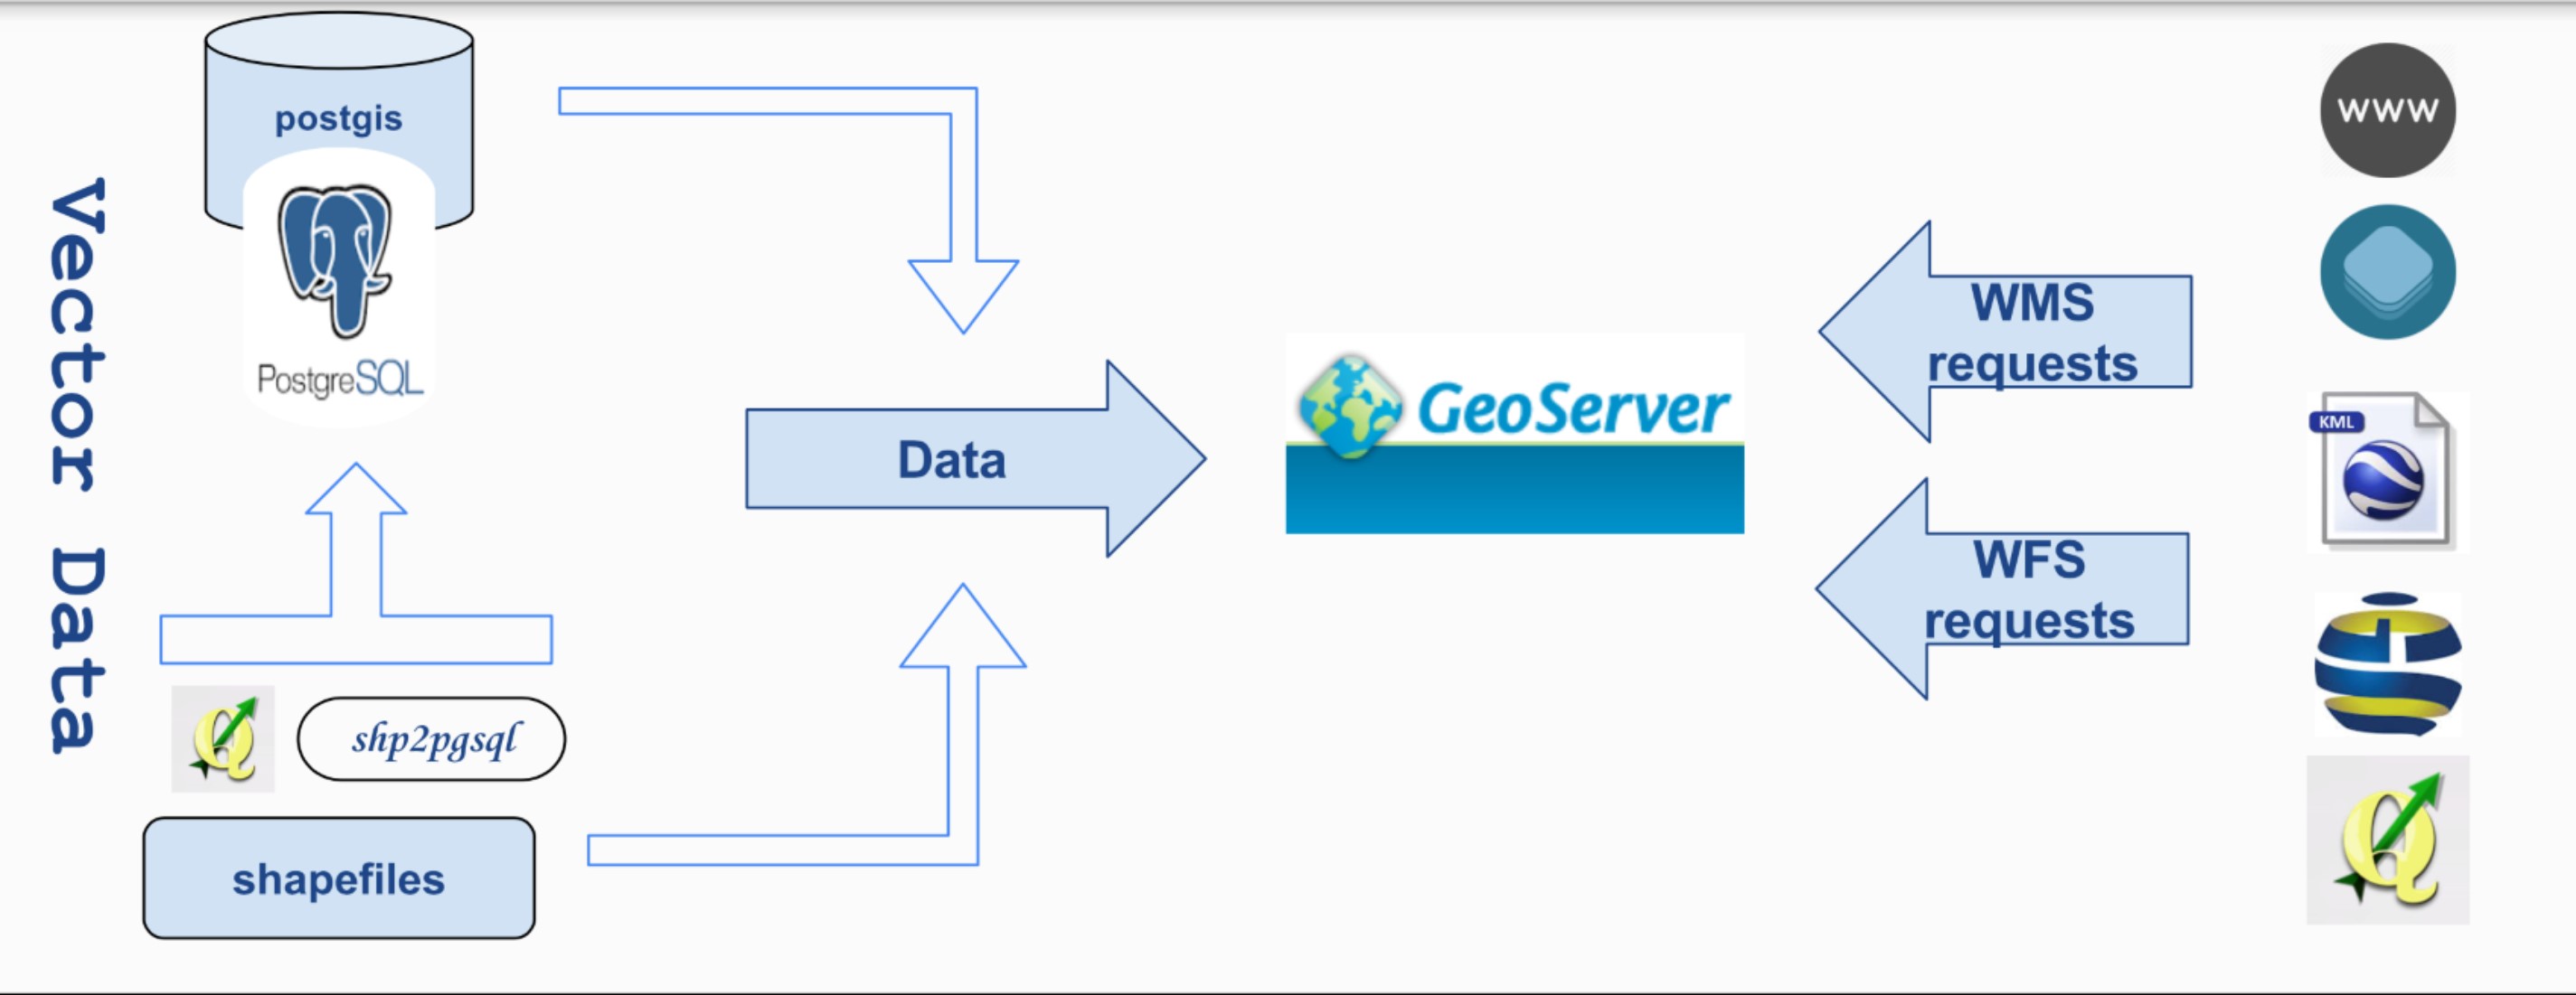
These requirements were met by using the following, well–established, open–source software (Figure 2):
- PostgreSQL,
- PostGIS,
- Geoserver, and
- Geonetwork.
Thanks to the use of standard formats and specifications, the data providers do not need to modify their own workflow for producing the layers. In our own workflow, for example, both QGIS and ArcGIS are used.
Downstream, the geographical information is provided in several formats via several interfaces:
- Ready–to-use maps (e.g. png images),
- Embedded viewer,
- Keyhole Markup Language (KML) files,
- Shapefiles,
- WMF, WMS, …
The human user is able to easily browse the available datasets, (pre-)view them and download the selected information. Corresponding functions, offered as "web-services" allow incorporating the available information into complex and distributed applications.
Content
Currently, only the zones were general or specific regulatory regimes apply, as defined in the marine spatial plan, are published. The following topics (mainly related to human activities) are covered:
- Nature conservation,
- Fisheries,
- Aquaculture,
- Shipping and dredging,
- Coastal protection,
- Sand and gravel extraction,
- Energy production areas, cables and pipelines,
- Military use,
- Scientific research, poles, radars, …
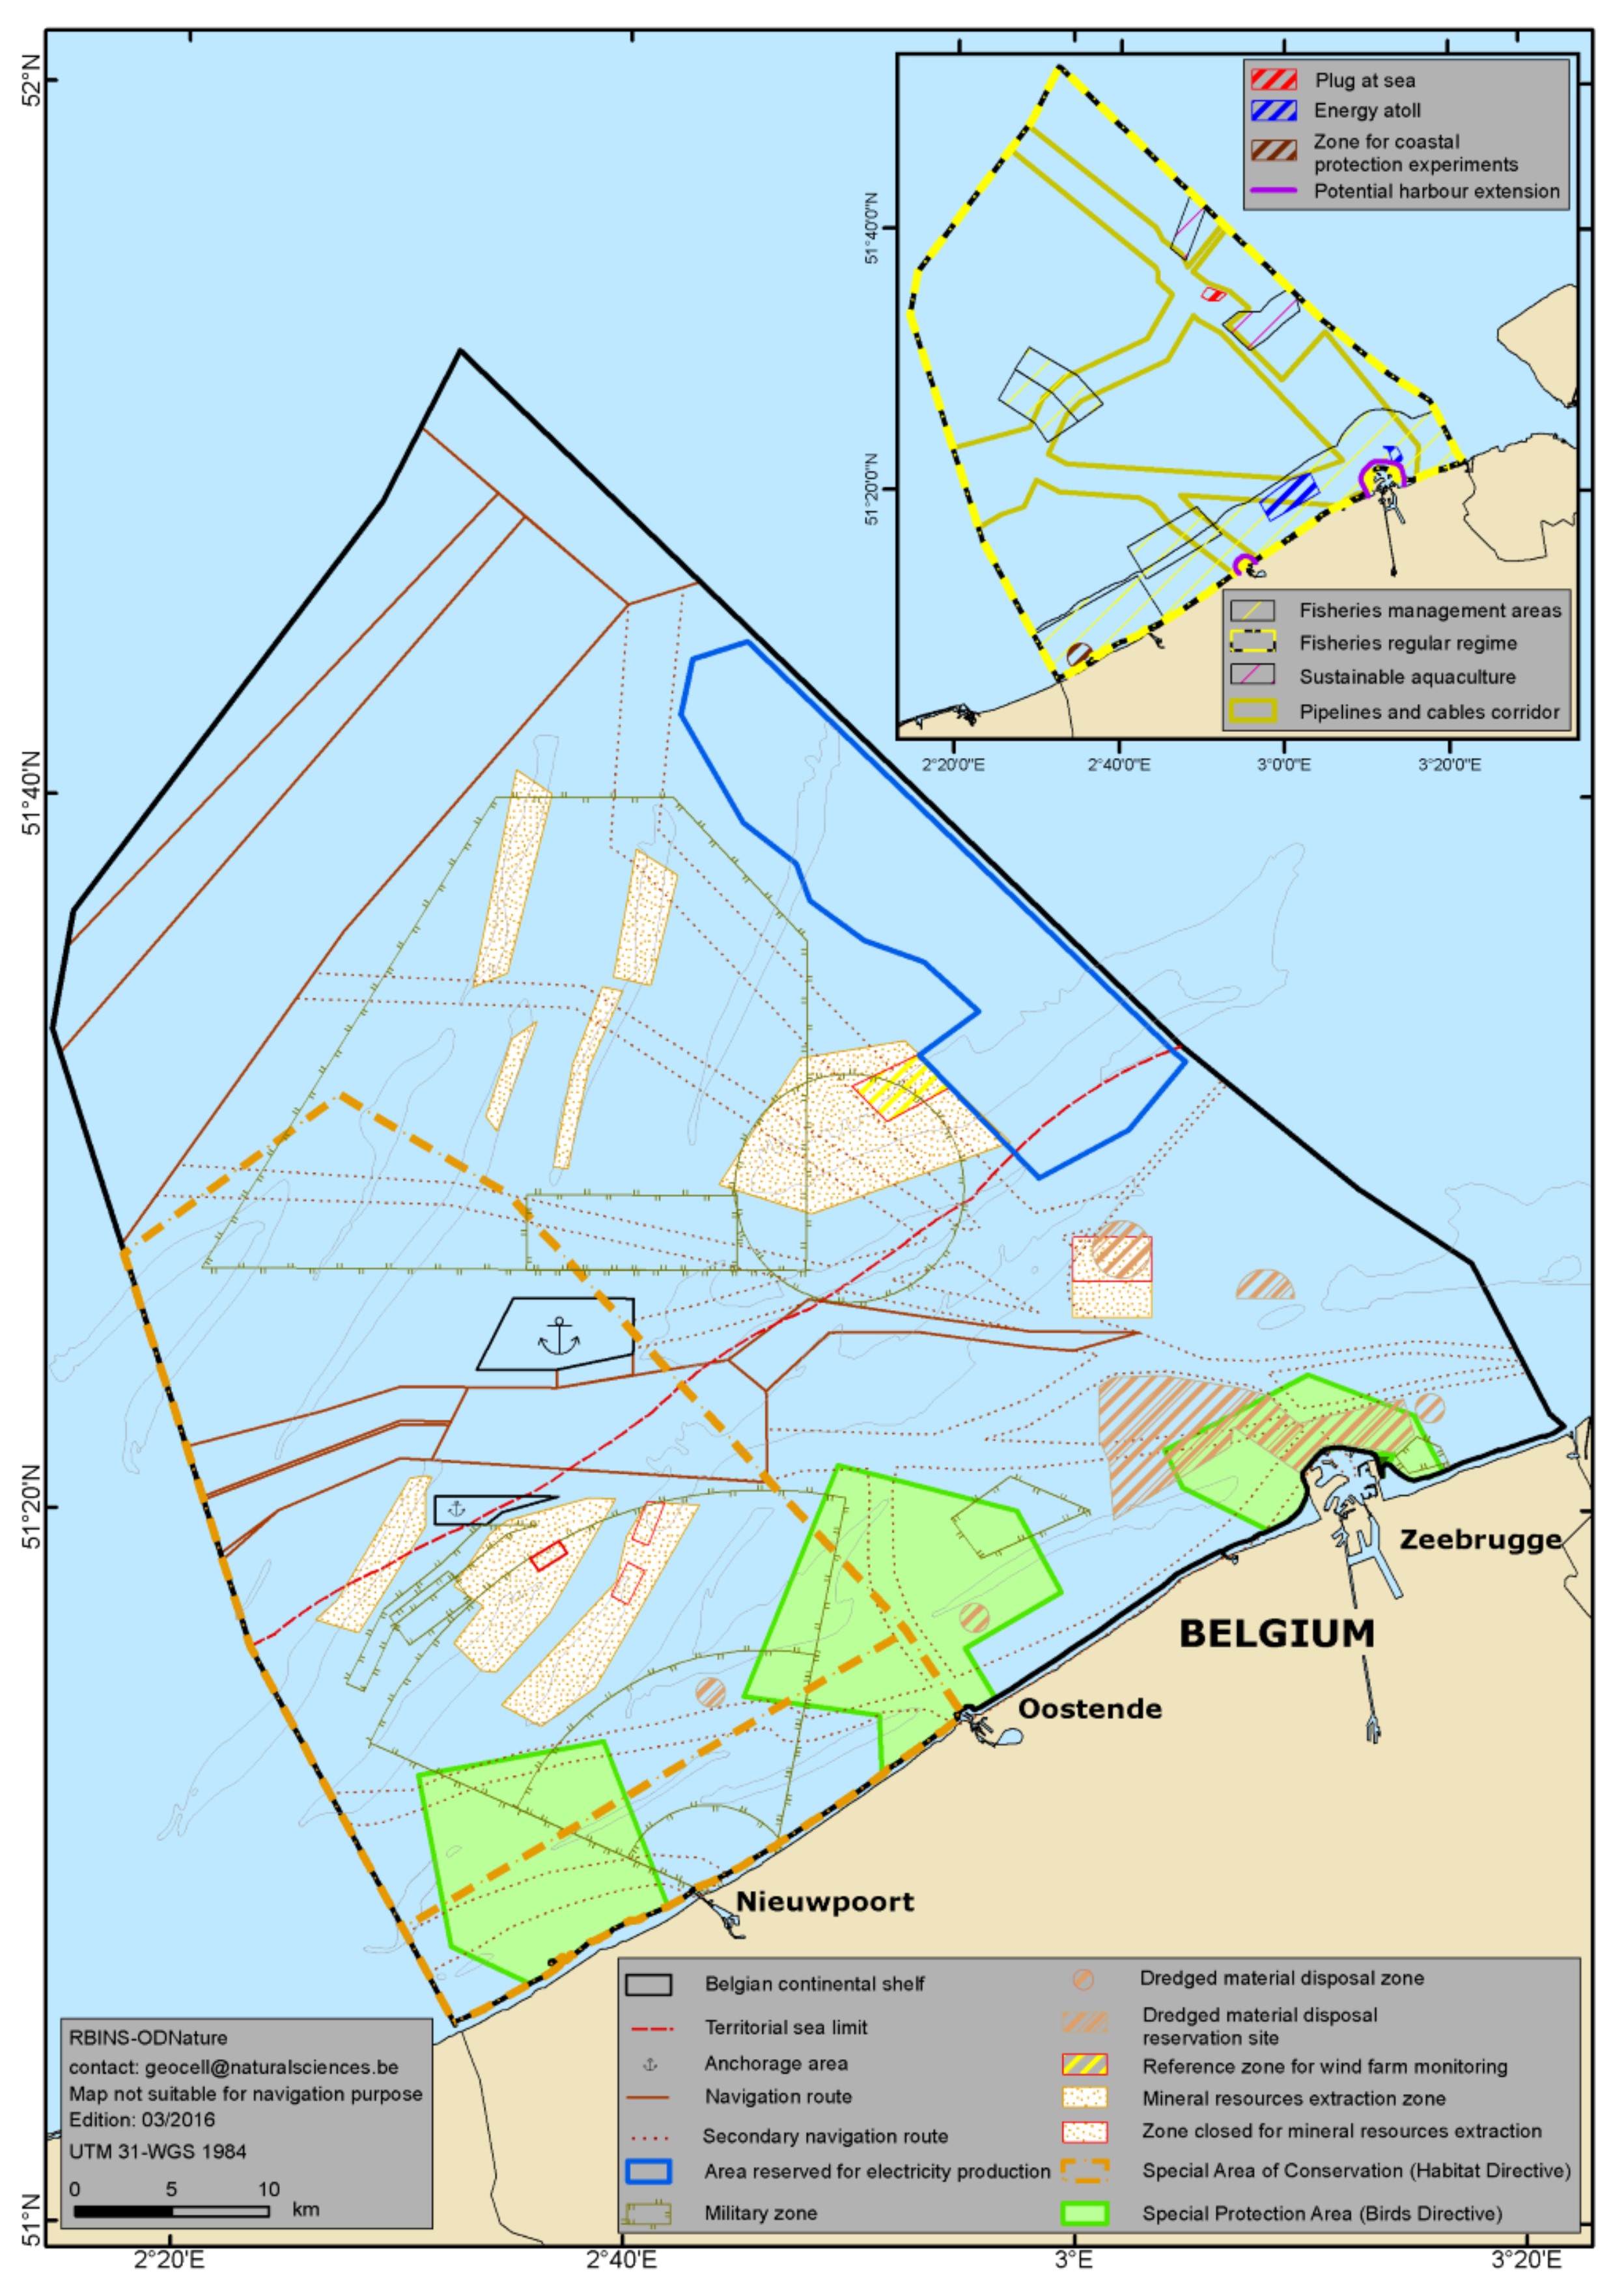
This geographical information forms the legal background of all human activities in the Belgian part of the North Sea (see Figure 1 on page 1). In other words, it doesn’t provide information on where such activities actually take place, nor their intensity or other characteristics.
Quality control issues
The importance of having a good work flow appeared clearly during the preparatory phase, especially the steps dealing with the quality control of the data. Although the geographical information published in the Belgian Official Gazette were deemed satisfactory by the authors of the plan, the digitization of the corresponding geographical features revealed several flaws that had to be corrected. For instance, for the definition of zones adjacent to the coastline they assumed an implicit closure of their polygon (in fact their polyline) by the coastline. Topological rigour is of course incompatible with implicit assumptions. Our corrections sometimes resulted in modifications of the decree in order to be legally, topologically and geographically consistent.
One of the biggest difficulties to solve when writing these corrigenda was to take into account that our reference coastline is “moving”. Indeed the Belgian coast is sandy and exposed to strong tidal currents (up to 1.5 m/s), what makes its morphology rapidly evolve at some places. Consequently the nautical charts are updated every 18 months. But the legal definition of the Belgian territorial waters (and, hence, of the full Belgian maritime domain) explicitly refers to the coastline “as depicted on large scale nautical charts”. Therefore, a rather complex (at least as seen by lawyers) topological formulation had to be found for defining locations “on” the coastline, in order to avoid publishing a new decree every one and a half years.
Compliancy with the INSPIRE directive
MarineAtlas.be aims at becoming the marine node of the federal geo-platform being implemented by the Belgian National Geographical Institute. Once this node and the infrastructure will be available, it will be much easier for the Belgian federal administrations to comply with the implementation of the INSPIRE directive and the international obligations that already require INSPIRE-compliancy, e.g. Marine Strategy Framework Directive, Marine Spatial Planning directive, EIOnet reporting... Our main tool for being compliant is the Geonetwork server. The metadata corresponding to the various published layers are progressively made available in conformity with the metadata ISO 19115 standard.
Languages
The web interface and the metadata are available in three languages: Dutch, French and English. However, the content that has a legal scope is given in English for informative purpose only, the official reference being the information provided in the Belgian official languages, Dutch and French (no official version in German being available for the moment).
Next steps
Content–wise, we intend to populate the web portal along four axes:
“Document what exists”: as aforesaid, the marine spatial plan defines zones where human activities are allowed, most of the time under specific conditions. Such activities (except for aquaculture) already take place. Concessions have been granted for wind farms and 182 windmills are already operational. The location and characteristics of these industrial facilities (according to the INSPIRE classification) will be published soon. Likewise, cables and pipelines were already laid down in the reserved corridors and we will also publish their coordinates “as laid”.
“Quantify what happens”: gravel is being extracted in the authorized sectors, sand and mud is extracted in the harbour channels and dumped in the designated areas, energy is being produced… All this results in quantities and statistics that will be turned into layers, thanks to the help of the other competent federal administrations (Economy, Mobility, …).
“Inform on the environmental status”: bound, like any EU Member State, by the “Marine Strategy Framework Directive”, Belgium has defined indicators of the environmental status of its maritime domain and is developing a programme of measures for achieving a “Good Environmental Status” by 2020. A monitoring programme is now in place, under the responsibility of RBINS. The scientific results of this monitoring programme and the evolution of the indicators they support will be published on the portal.
“Publish scientific knowledge”: RBINS has a long oceanographic tradition. Its researchers are active in physical and chemical oceanography. They perform intensive studies on the biodiversity of the North Sea, with a multi–disciplinary (aka “ecosystem”) approach. The accumulated knowledge will be translated into synthetic layers e.g.: TS-climatologies, tidal currents patterns, swell energy, sediment dynamics, habitat mapping, contaminants distribution …
Regarding the features of the portal, we will mainly focus on the improvement of our embedded browser, which at the early stage of development.
Conclusion
The publication of the official Belgian marine spatial plan, well in advance of the obligations set by the EU Directive on Marine spatial planning and together with the mandatory implementation of the INSPIRE directive, offered not–to–miss leverage to initiate a marine geographical information portal at the Belgian federal level. Although means were limited the legal background information is now available in various formats and through various protocols. The development team has set plans for upcoming improvements but will happily appreciate any feedback from users and experts to steer their efforts.
Acknowledgements
The Geocell team of RBINS wants to thank Fabrice Ovidio and Samuli Kauranne (SWAP, Scientific Web sites and Applications, RBINS) for publishing the web portal, Marc Roche and Koen Degrendele (FPS Economy) for their challenging use of our data in their Google Earth application and the Marine Environment service of the FPS “Health, Food Chain Safety and Environment” for their financial support and their understanding when we asked them to change the legal texts.
Development of a Coastal Atlas for the Emerging Tidal Energy Industry in Nova Scotia
- Detalles
- Publicado: 15 Diciembre 2015 15 Diciembre 2015
The Acadia Tidal Energy Institute in partnership with Atlantic Canada Opportunities Agency, Nova Scotia Department of Energy, Offshore Energy Research Association, Fundy Ocean Research Centre for Energy (FORCE) and Tekmap Consulting are developing an interactive web map to make Nova Scotia tidal energy-related spatial information readily available to the public.
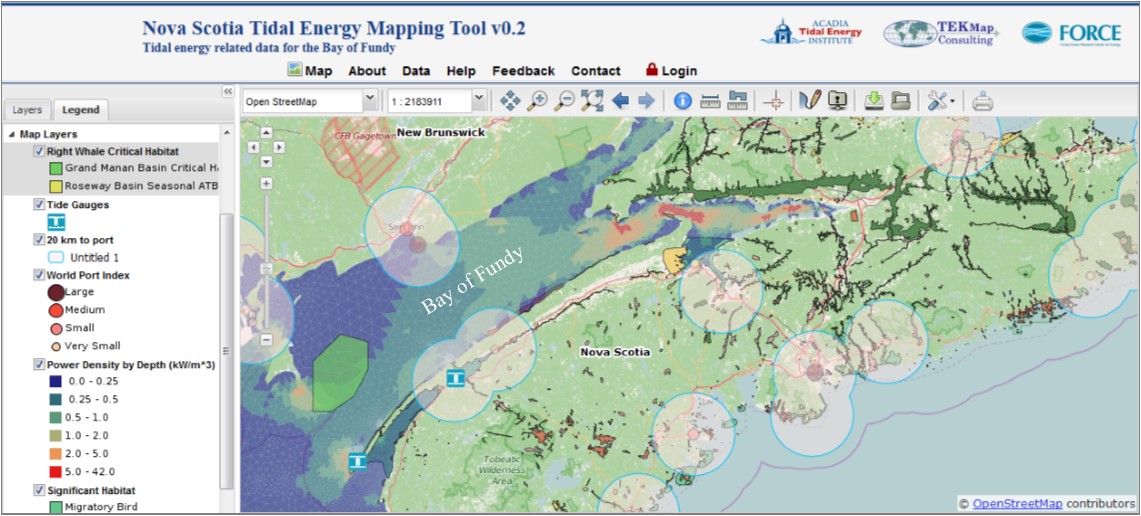
Right Whale critical habitat, 20 km buffers from ports (created with the vector buffer tool), power density and significant habitats
Introduction
Nova Scotia, Canada is home to the world’s highest tides and in six hours more water flows into the Bay of Fundy than the combined flow of all the world’s freshwater rivers. The tidal energy resources are significant here and in-stream tidal energy development is underway in several high flow locations in Nova Scotia.
Over the past decade a considerable amount of tidal energy-related spatial data has been acquired from many projects, researchers and regions. These studies support the developing industry through risk reduction and informed decision making. Much of the data available for the tidal energy industry in Nova Scotia is in the form of lengthy technical reports and large data sets housed by numerous institutions. Accessing information for technical analysis, business development and community engagement requires extensive exploration. To overcome this challenge, these otherwise disparate sets can be successfully combined, displayed and manipulated in a web-enabled platform.
Background
A proof-of-concept was developed in the spring of 2014 with seed funding from the Offshore Energy Research Association of Nova Scotia (OERA). The aim was to build a decision-making tool that integrates complex spatial information of importance to the emerging tidal energy industry while also being scalable, flexible and accessible — prudent features of a rapidly evolving industry. The platform is built on open source software and uses the industry standard for communicating spatial data. The proof-of-concept successfully integrated the high-resolution hydrodynamic modeling work of Dr. Richard Karsten and Dr. Joel Culina in the Minas Passage and Digby regions and several other layers of interest into an online map. We are now bringing this web map to a level of public readiness.
Objectives
The overall objective of this mapping project is to support an emerging industry that can bring long-term wealth and energy independence for the province while respecting the environment and other stakeholders’ needs. This project seeks to have data easily available to those who need it most: community members, decision makers, researchers, government regulators, industry developers, consultants, investors and non-profit organizations.
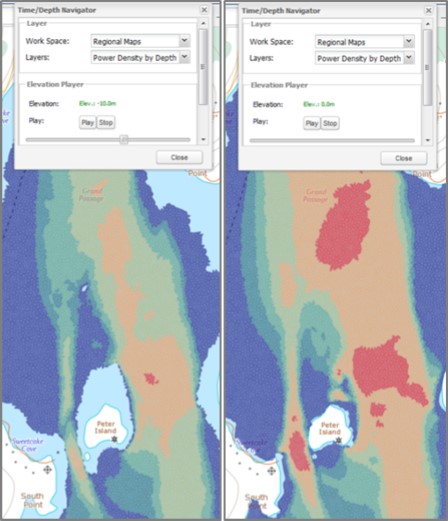
for Grand Passage, Digby Neck at a depth of 10 m (left) and 0 m, surface (right)
This tool will support advancement of an emerging industry, by avoiding duplication of efforts, identifying knowledge gaps and engaging stakeholders. Data from existing, ongoing and future research projects will be used to inform new research, education, economic development, capacity building, planning and maintenance.
Planned Outputs
The web map with tidal energy-related data and tools will be publically available in early 2016. Supplemental materials such as user guides, instructional videos and educational resources are being created to assist with accessibility and user experience.
Facilitating Data Exploration
The web map currently has standard interactive tools such as pan, zoom, measure length, measure area, print map and get feature information. In addition custom tools are being developed to enhance visualization and understanding for the user. They include:
- Vector Buffer: Create buffers around user selected layers. Useful for visualizing detection ranges for acoustic monitoring devices, determining proximity to marine protected areas, ports, substations and other important features.
- Draw Features: Draw points, lines, polygons, and labels on the map for printing and downloading.
- Vector / Raster Style Editor: Change color, name and appearance of vector layers. Customize color ramp in raster layers.
- Time / Depth Navigator: Visualize time and depth enabled layers. Useful for tidal flows, marine life detection, etc. (Figure 2).
- Score Tidal Model: Allows the user to select the model of interest and specify which hydrodynamic model metrics and values to query. Query results for the selected model appear as a new map layer (Figure 3).
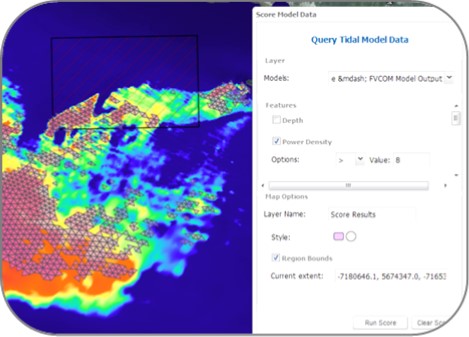
Minas Passage model where power density is greater than 8 kW/m3.
Other visible layers include the power density raster image and the FORCE Crown Lease Area (white box).
Live in 2016
The emerging tidal energy industry is advancing rapidly and will see large commercial tidal energy extraction devices deployed in the next few months at the Fundy Ocean Research Centre for Energy in the Minas Passage, and small scale turbines deployed in the Digby passages by 2017. New provincial legislation regarding commercial scale developments will soon be released to support tidal power development in Nova Scotia. By consolidating the information and data gathered for tidal energy development, and making it easily available to stakeholders over the internet, regional and site-specific knowledge can be transferred in an efficient, cost effective manner to encourage responsible development of tidal energy.
For more information on the project please visit: http://tidalenergy.acadiau.ca/ns-tidal-energy-web-map.html