
The Marine Analyst - An aid to the monitoring and management of marine areas, including marine protected areas
- Detalles
- Publicado: 09 Noviembre 2016 09 Noviembre 2016
Nicolas Hoepffner1, Pascal Derycke1, Laurent Dubroca2
Esta dirección de correo electrónico está siendo protegida contra los robots de spam. Necesita tener JavaScript habilitado para poder verlo.
1- European Commission – Joint Research Centre, Directorate for Sustainable Resources,
D.2 Water and Marine Resources Unit, via Fermi 2479, I-21027 Ispra (Va), Italy
2- Laboratoire Ressources Halieutiques, Ifremer, Avenue du general de Gaulle, BP 32, 14520 Port-en-Bessin, France
Through the analysis of satellite data and modeling outputs, the Environmental Marine Information System (EMIS) of the European Commission – Joint Research Centre aims at an effective and long-lasting marine and coastal stewardship by providing scientific and technical value-added products to assist in monitoring and assessing water quality, biodiversity, ecosystem health status in Europe and globally. The EMIS spatial data infrastructure and web-GIS viewer (http://mcc.jrc.ec.europa.eu/emis/) allows discovery, navigation and browsing through the data in different ways, according to spatial resolution, the variable to be analysed, and the time period. Another set of applications has been developed to query the data and perform statistical analysis on the region of interest. Additional functions enable the users to download datasets in different formats (netCDF, GeoTIFF), to print maps and to download results directly on ready-to-use PDF files.
EMIS offers web services as Web Map Service (WMS) and time Web Coverage Service (WCS-t) in accordance with the Open Geospatial Consortium (OGC) specifications and EU INSPIRE standards to ensure full interoperability. The EMIS web services are associated to R-written functions allowing the online processing of the data, their analysis and reporting.
Recently launched, the EMIS Marine Analyst provides simple methods to explore any pre-defined areas of the European seas and global ocean and assess the pressures to which they are exposed. For example, it assists in the management of Marine Protected Areas (MPA) and is conceived as a tool to support the implementation of environmental directives, e.g. the EU Marine Strategy Framework Directive (MSFD), through communicating environmental information/indicators of relevance to various policy descriptors. Following the user's election of e.g. a given MPA (MPA list as derived from the UNEP-WCMC World Database on protected areas), the Marine Analyst is evaluating in real time the environmental status of the MPA taking into consideration the EMIS database. The final outcome is given in a format of a report including geographical and bathymetry mapping of the MPA, a range of statistical analysis and time-series plots of the different variables, and the full series of monthly satellite views of each of the variables.
Applying the Marine Analyst around the Balearic Las Salinas Marine Park (all figures are extracted from the marine analyst report):
The marine park of Las Salinas in the western part of the Mediterranean Sea is a protected area located between southeast Ibiza island and the northern tip of Formentera Island. It covers a marine area of ca. 14,000 ha classified in the Natura 2000 Network, as well as being a site of Community Interest and an Area of Special Protection for Birds since 2006.
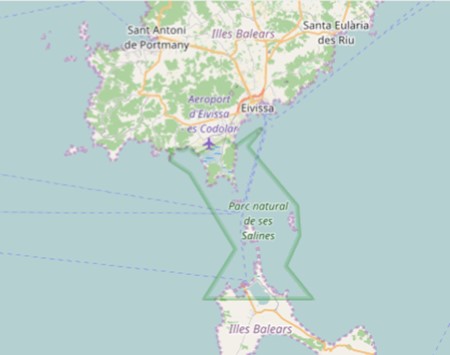
Las Salinas, Balearic Islands, western Mediterranean Sea (© www.openstreetmap.org )
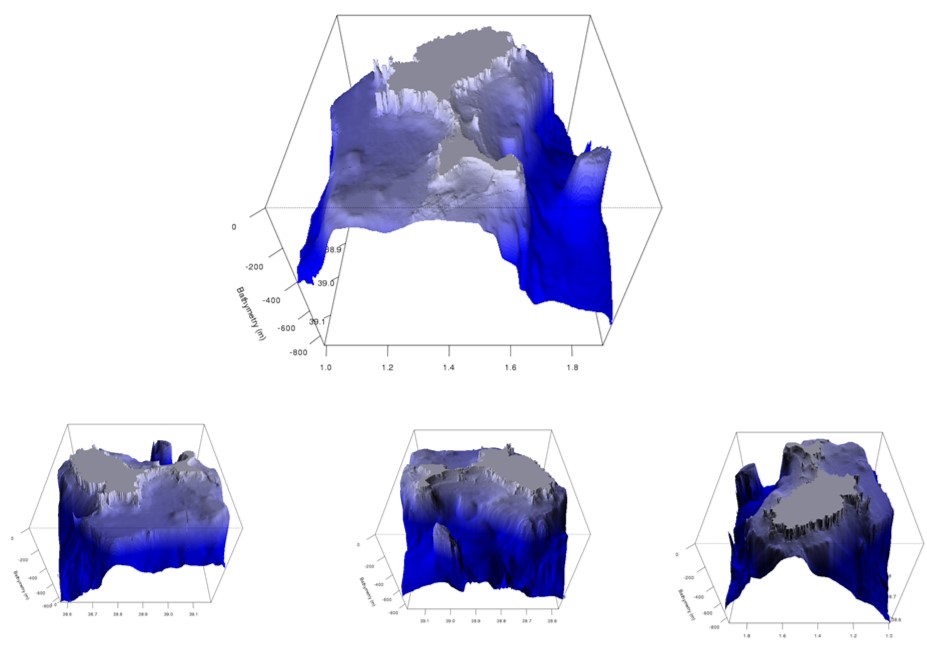
The marine Analyst report includes 2-D (not shown) and 3-D bathymetry maps of the area, created from the last release (2016) of EMODnet DTM product (http://www.emodnet-hydrography.eu) covering European seas at ca. 230 m grid resolution. The 3-D maps are given in 4 different perspectives, enabling a better vision of the topography on either side of the MPA.
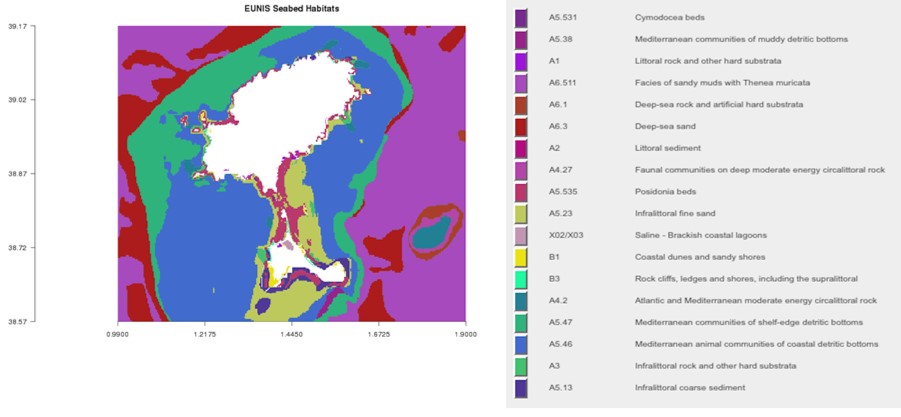
The report also provides EUNIS-compliant information on seabed habitats complemented with geospatial information from the UNEP’s Global Seafloor Geomorphic Features Map (GSGFM), following a methodology described in Tempera (2015). The marine Park and surrounding waters are characterized a large variety of seabed structures profitable to different ecosystems. Posidonia beds extend in shallow waters along the strait between both islands, lying on fine sand. On either side of the strait, the ecosystem progressively shifts from coastal to shelf-edge detritic bottoms.
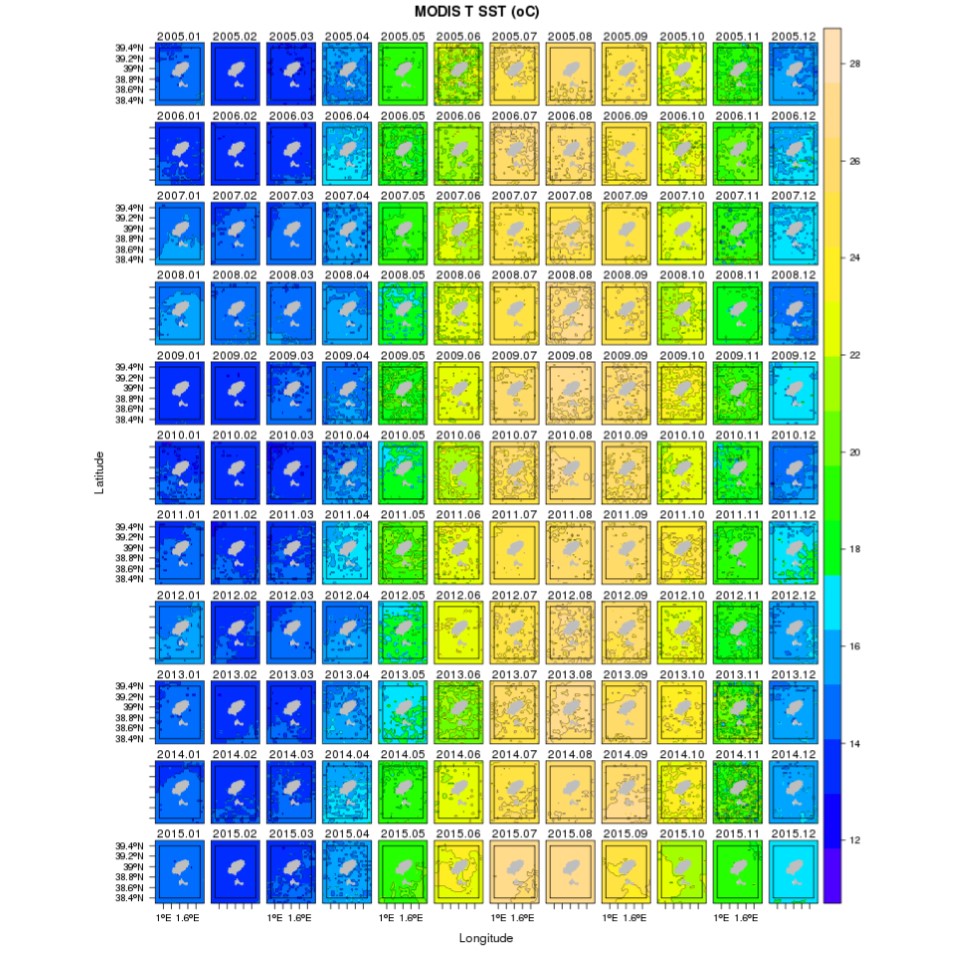
Together with such structural aspects of the area, the marine analyst reports on a series of environmental variables, with associated maps and statistics, that are relevant to monitor potential changes in the state of the ecosystems, biodiversity and water quality. The variables are either satellite-derived (e.g. sea surface temperature, chlorophyll concentration) or model-derived (e.g. mixed layer depth, bottom temperature and salinity). For example, maps of monthly SST from the satellite-based MODIS-Terra radiometer show the variability of sea surface temperature over a decade within the MPA and surrounding waters.
The associated anomaly maps, calculated from the difference between monthly observation and 10-year monthly climatology, permit the identification of substantial deviations of the environment around the MPA from natural variability. For example, a significant negative anomaly in SST can be observed in May-June 2013 concurring with the local weather forecast that had identified the largest number of cooler days during that period.
Similar maps are provided for time-series of phytoplankton biomass (i.e. chlorophyll concentration) and water transparency (diffuse attenuation coefficient) using data from the MODIS-Aqua sensor. All statistics associated to these variables are provided for the MPA area with the possibility to download the data for further analysis.
In addition to the mean values and standard deviations, trends for each variable are calculated over the time series according to Vantrepotte and Mélin (2009) where the time-series of the variable is decomposed into a seasonal signal, a trend, and a residual component.
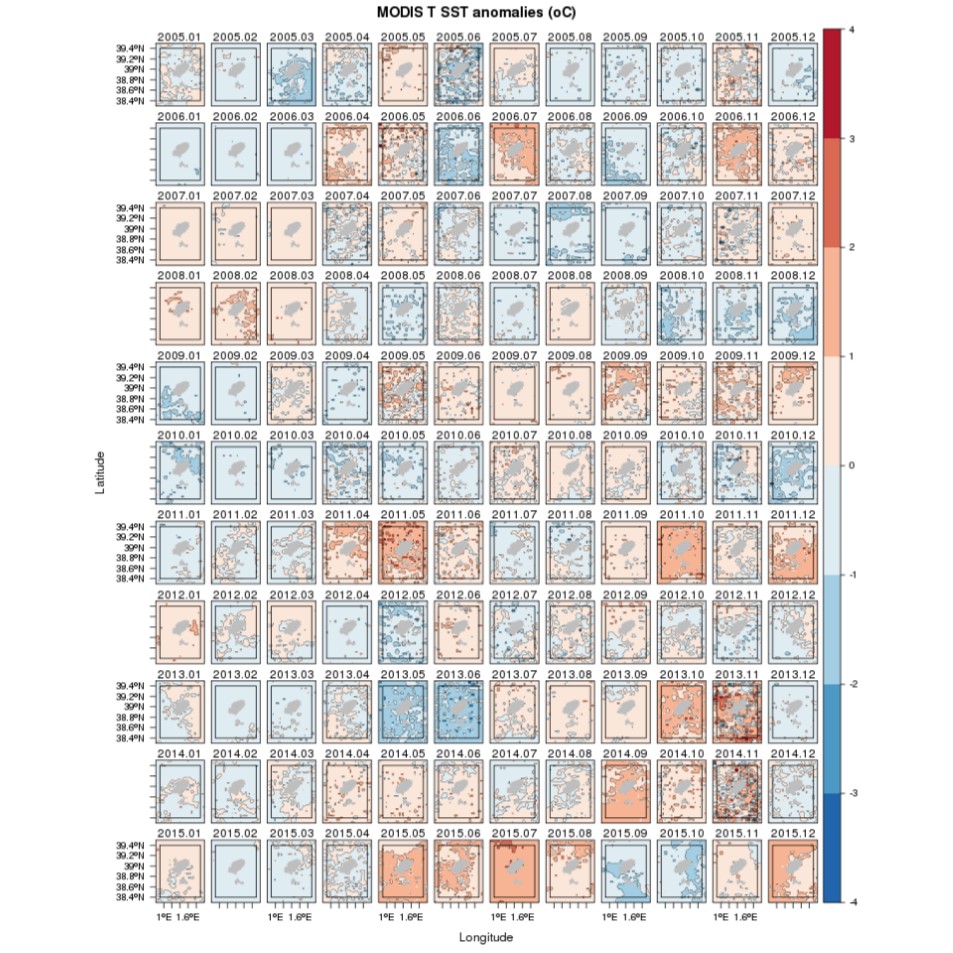
Figure 5: Monthly maps of sea surface temperature anomalies
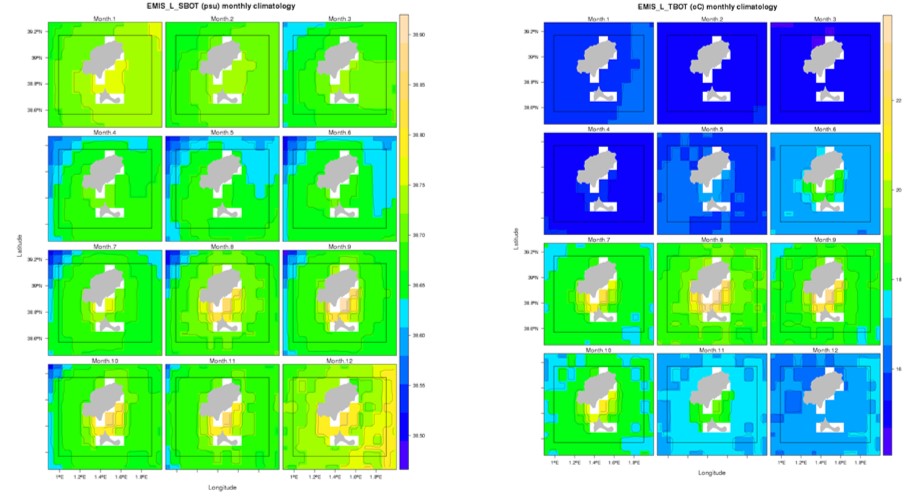
The analysis of the surface variables observed from satellite are complemented with outcomes of 3D hydrodynamic model describing the water column and bottom physics. For example, climatological values (monthly) of the bottom salinity are estimated over a decade period using the freely available General Estuarine Transport Model (GETM; http://www.getm.eu). The variability of these physical parameters are important to evaluate the status of benthic ecosystems within the protected area.
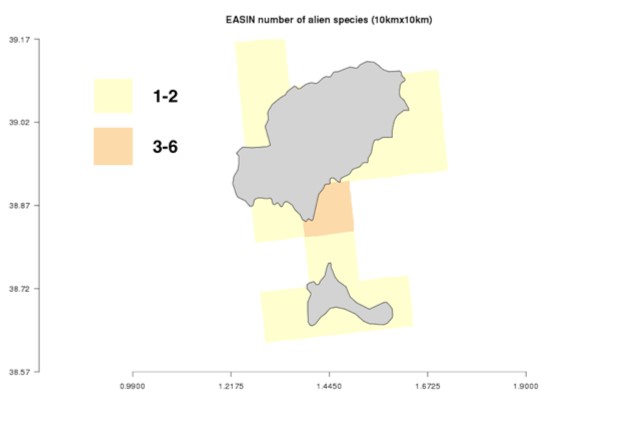
Lastly, the EMIS marine analyst is reporting on habitats of important commercial fishes and occurrence of alien species. Bluefin tuna feeding and spawning habitats (not shown here) are implemented in the system according to Druon et al. (2016) at spatial and temporal resolution suitable for dynamic management of fisheries. Furthermore, alien species occurring in the area are extracted from the European Alien Species Information network (EASIN; http://easin.jrc.ec.europa.eu) which maintain an inventory of all known alien and cryptogenic species in Europe as required by the Convention on Biological Diversity and EU Regulation on the prevention and management of the introduction and spread of invasive alien species. A range number of alien species is given on a 10x10 km grid, with the species names possibly occurring in the studied area (Asterionellopsis glacialis, Atherina boyeri, Calyptraea chinensis, Colpomenia sinuosa, Fusinus rostratus, Gibbula adansonii, G. albida, Haliotis tuberculata, Hexaplex trunculus, Paracaprella pusilla, Percnon gibbesi, Sabella spallanzanii).
As shown (partially) in this example of a local analysis, the Marine Analyst tool of the Environmental Marine Information System (EMIS) has features and components that are specifically dedicated to assisting in the management of marine and coastal waters in Europe and globally. The tool is derived from an EMIS-R package and implemented at the core of the EMIS server. It provides an interoperable spatial data infrastructure platform enable to integrate and communicate different spatial and referenced datasets and services in a standardized way.
The marine Analyst has been integrated into the Marine Strategy Framework Directive Competence Centre (MCC; http://mcc.jrc.ec.europa.eu) established by the Joint Research Centre to share marine policy information, and provide up-to-date scientific knowledge related to MSFD.
References
- Druon JN., Fromentin JM, Hanke A, Arrizabalaga H, Damalas D, et al. 2016. Habitat suitability of the Atlantic Bluefin tuna by size class: an ecological niche approach. Progress in Oceanography, 130: 188-204.
- Tempera F, 2015. Bringing together harmonized EUNIS seabed habitat geospatial information for the European seas. EUR – Scientific and Technical Research Reports, Publication Office of the European Union, EUR 27237.
- Vantrepotte V, Mélin F, 2009. Temporal variability of 10-year global SeaWiFS time series of phytoplankton chlorophyll a concentration. ICES Journal of Marine Science, 66: 1547-1556.
Marine Scotland Information
- Detalles
- Publicado: 07 Noviembre 2016 07 Noviembre 2016
Drew Milne
Esta dirección de correo electrónico está siendo protegida contra los robots de spam. Necesita tener JavaScript habilitado para poder verlo.
Marine Scotland has recently launched a new website called Marine Scotland Information (http://data.marine.gov.scot). This is designed to act as a central information portal, providing context and connections for the data and resources that Marine Scotland publishes online. It forms part of the Marine Scotland Open Data Network acting as the link between our geospatial platform National Marine Plan interactive (http://maps.marine.gov.scot) (NMPi) and the Data Publication Portal (http://data.marine.gov.scot) to give an integrated suite of services for end users.
Marine Scotland Information automatically collates resources from the other two portals and combines these in information pages where they can be put into context and related to other maps or data downloads.
Whilst both NMPi and the Data Publication Portal provide specialised functionality, Marine Scotland Information is designed to be approachable by all. Content on Marine Scotland Information is presented through the use of information themes and specific data and map categories. Users are able to search across the wide range of topics or delve directly to the subject or data type they require. Specific map layer and data resource information is automatically kept up to date and users are able to access various levels of detail as required.
All map layers on NMPi now have an associated information page on Marine Scotland Information and the new site also manages the resources previously held on the Marine Scotland interactive website.
Marine Scotland Information was built internally using Drupal, an open source Content Management System, which allowed for a flexible development process and access to a wide range of resources available in the open source community. Taxonomies have been used throughout the portal allowing relationships to be built and presented to users providing a more detailed understanding of the information and data available. It also allows users to access the information through a variety of routes. Additionally, the content of MSI will also be available through machine readable services allowing other systems to harvest our information automatically.
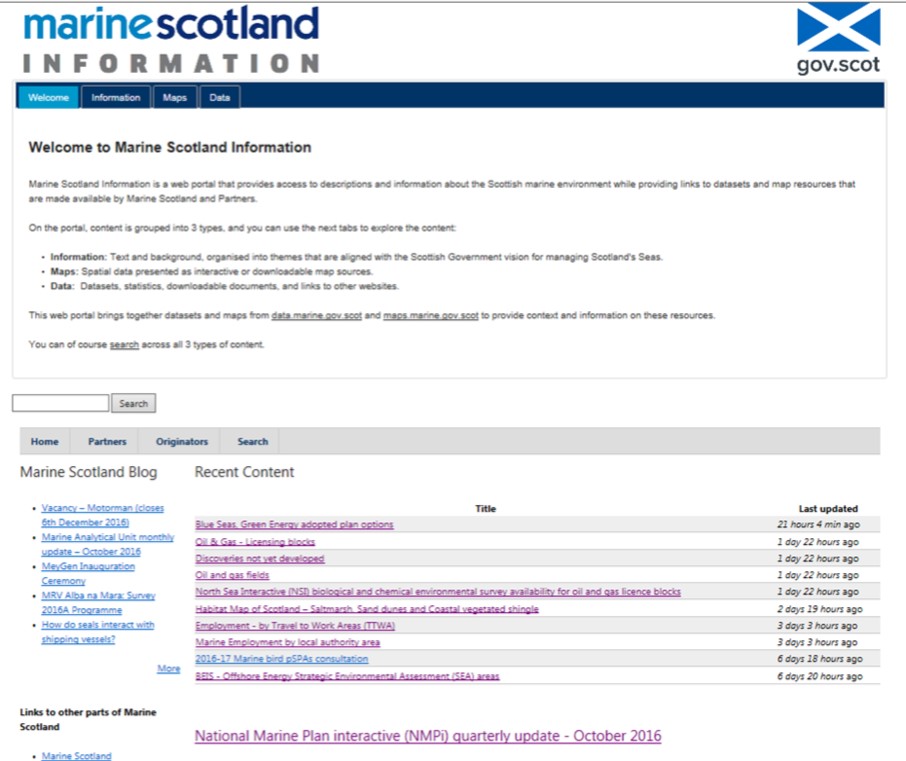
Content on Marine Scotland Information is grouped into three types:
- Information: Text and background, organised into themes that are aligned with the Scottish Government vision for managing Scotland's Seas.
- Maps: Spatial data presented as interactive or downloadable map sources.
- Data: Datasets, statistics, downloadable documents, and links to other websites.
The site is available for all marine stakeholders and demonstrates Marine Scotland’s commitment to openness and transparency in its data for the management of Scotland’s seas.