Web Services for Coastal and Marine Atlases
- Detalles
- Publicado: 25 Septiembre 2013 25 Septiembre 2013
Keiran Millard
Esta dirección de correo electrónico está siendo protegida contra los robots de spam. Necesita tener JavaScript habilitado para poder verlo.
HydroView Now is a range of free to use web mapping services developed by SeaZone. They have been developed for users building and delivering coastal and marine atlases. HydroView Now provides all the key base-mapping and reference features generally needed in developing marine and coastal atlases, allowing users to focus on their content and analysis.
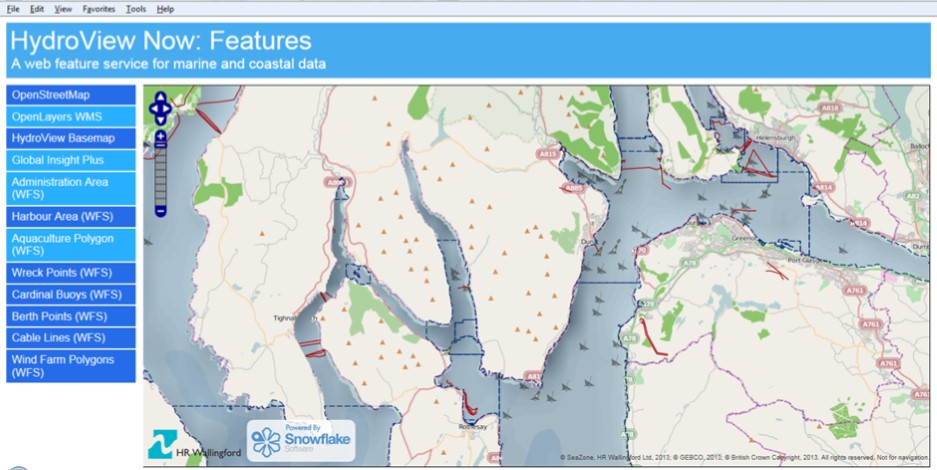
HydroViewNow: Basemap and OpenStreetMap
Fully standards-based, the services work in web mapping applications as well as desktop clients such as ArcGIS and QGIS. They comprise two services: HydroView Now: Basemap and HydroView Now: Features.
http://www.scotland.gov.uk/Topics/marine/seamanagement/nmpihome/nmpi
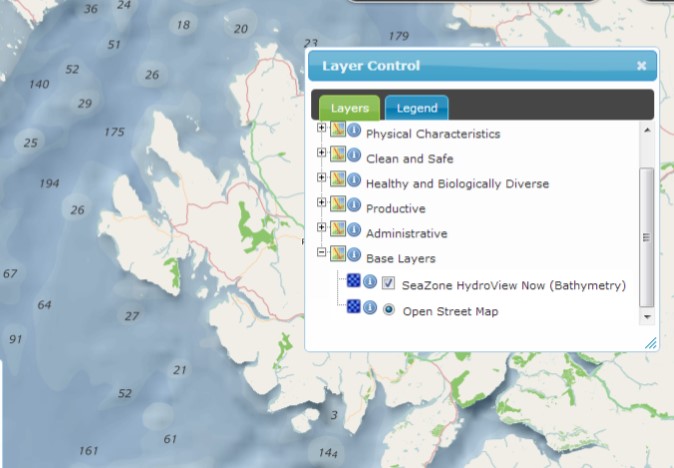
HydroView Now : Basemap
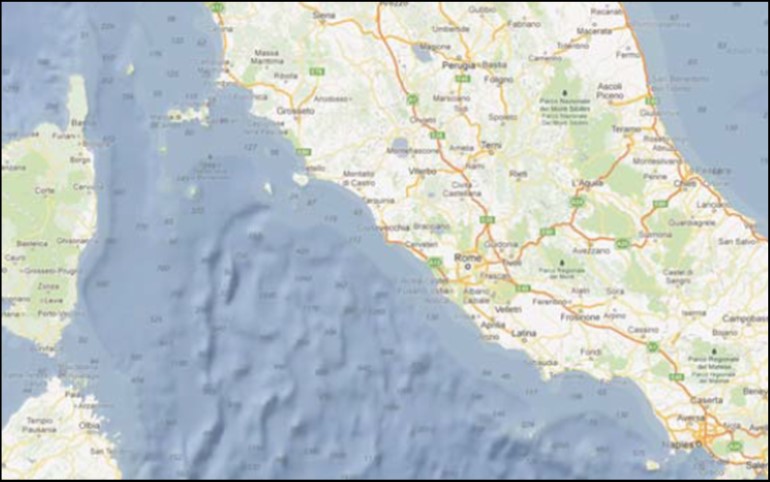
A WMTS for global bathymetry. This a cartographic product showing hill-shaded bathymetry alongside depth soundings derived from nautical charts. It contains a transparent land-mask meaning it can be used alongside your choice of land mapping, e.g. OpenStreetMap or BingMaps
HydroView Now : Features
A WFS for global marine feature types. This provides a definitive worldwide marine reference feature types derived from national hydrographic and other authoritative sources. The content is processed to form a continuous vector layer dataset aligned to the draft IHO S-100 GML profile.
Both services are delivered through an authenticated web service interface, allowing users to consume the service via an application programming interface. They are both deployed in the cloud delivering the performance and reliability that users are accustomed to with modern web mapping.
View HydroViewNow at
http://seazone.viaeuropa.uk.com/viaeuropa/apps/szdemo/
SeaSpace – Providing Satellite Data as a Marine Web Atlas
- Detalles
- Publicado: 13 Septiembre 2013 13 Septiembre 2013
Keiran Millard
Esta dirección de correo electrónico está siendo protegida contra los robots de spam. Necesita tener JavaScript habilitado para poder verlo.
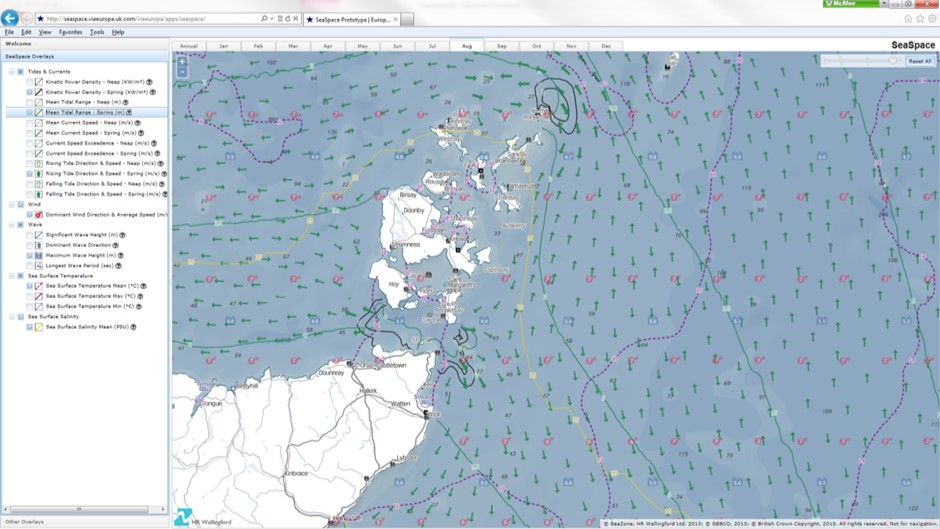
SeaSpace is a marine atlas part-funded by the UK Space Agency, and was set up to address a particular aspect faced by marine and coastal users, namely how to consume information from large data sets (typically from earth observation missions and numerical models) – without having to download and process large binary data files?
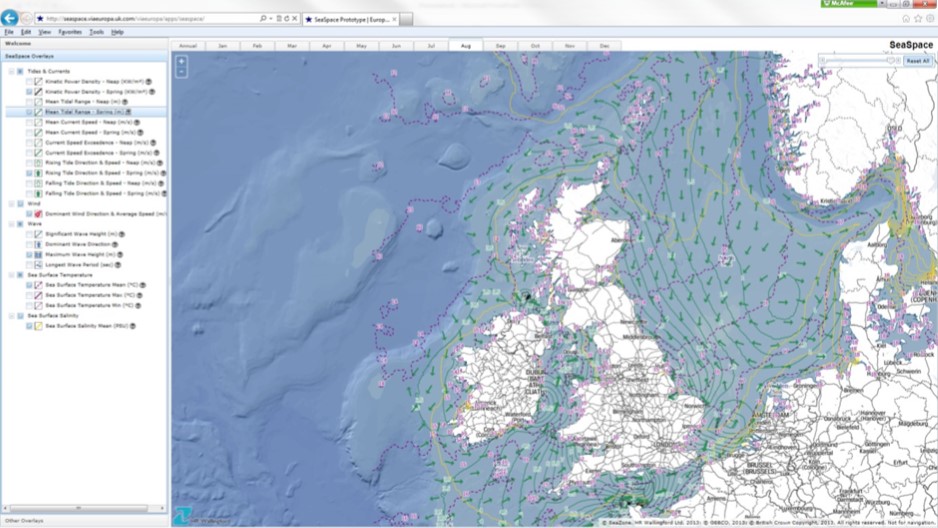
Users wanted a solution that was “like Google Maps” that provided a simple interface to communicate to them, in a meaningful way, what these large datasets contained. What’s been delivered is not just a standalone atlas, but a standards-compliant WMTS with an API enabling others to use the service.
SeaSpace is not a scientific challenge – the technology pieces exist, it’s about taking what exists and tailoring it to deliver the atlas—in particular large archives of marine data derived from earth observation missions, processing infrastructure for large datasets and standard web services that users are familiar with. Formally three objectives were addressed in SeaSpace:
- To exploit data across a range of different satellite missions observing the marine environment; advancing the uptake of existing missions and feeding back to the space community gaps in observing capability.
- To help bridge the gaps between publically funded services for processing earth observation data (e.g. GMES1 / ESA Due2) and the consumption of this data at the community level; establishing a persistent relationship between these communities.
- To introduce the Data as a Service (DaaS) concept and representation of earth observation data as explicit geographic Features Types, enabling the exploitation of existing data archives and ongoing missions.
From a technical point of view, the focus of the Sea Space project is about taking large and complex datasets and extracting specific information from them that conforms to definitions agreed within user communities. For the prototype SeaSpace atlas, the offshore renewable energy industry was adopted as a target user community. This goes somewhat against how data services have traditionally been delivered which is to adopt a ‘lowest common denominator’ approach. In SeaSpace we deliberately sought to process the data to maximize information available, irrespective about whether we were duplicating content. So, if the user would like maximum, minimum and mean of ocean temperature we would generate these statistics and present them as separate information. The parameters extracted for the trial atlas are shown in the table below:
Data layer |
Definition |
Kinetic Power Density |
The measurement of the mean hydrokinetic resource in KW/m2 for both the Neap (n) and Spring (s) cycles of an average 14.5day tidal period. The minimum economic threshold for site development is often considered to be around 1 KW/m2. For outstanding sites, the kinetic power density may exceed 5 KW/m2 |
Bathymetry |
Gridded bathymetric surface with spot height soundings. The requirement here was a batyhmetric surface that was “cartographically good”, providing a backdrop to multiple oceanographic features. |
Mean Tidal Range |
The difference between high tide and the succeeding low tide, averaged over both the Neap (n) and Spring (s) cycles of an average 14.5day tidal period and measured in metres. |
Mean Current Speed |
The mean current speed (measured in metres per second) predicted for both the Neap (n) and Spring (s) cycles of an average 14.5day tidal period. |
Current Speed Exceedance |
The value of the current speed (measured in metres per second) exceeded 10% of the time in the 14.5day tidal period. |
Rising Tide Direction & Speed |
Mean peak current speed (m/s) and corresponding direction of the rising/flood tide, calculated both for the Neap (n) and Spring (s) cycles. |
Falling Tide Direction & Speed |
Mean peak current speed (m/s) and corresponding direction of the falling/ebb tide, calculated both for the Neap (n) and Spring (s) cycles. |
Dominant Wind
|
Dominant wind direction and monthly average wind speed at 10m height above sea level (in metres per second) |
Mean Significant Wave Height |
Wave Height is defined as the vertical distance between the crest of one wave and the preceding trough and the Significant Wave Height is described as the mean height of the largest third of the zero-up-crossing waves. |
Significant Wave Height
|
The Significant Wave Height (in metres) that is exceeded 10% of the time. |
Dominant Wave Direction |
The most dominant wave direction measured in degrees. |
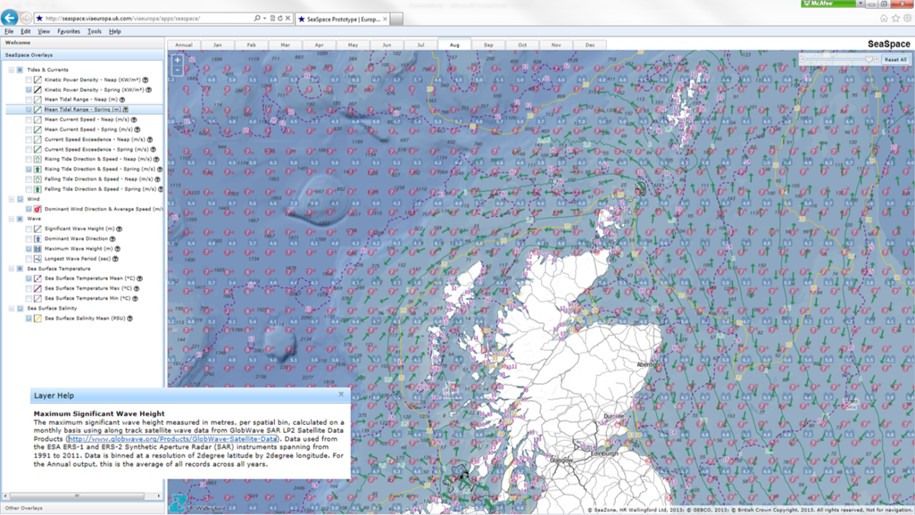
Maximum Significant Wave Height |
The maximum significant wave height, measured in metres. |
Longest Wave Period |
The longest wave period, defined as the longest time it takes two successive wave crests to pass a given point, measured in seconds. |
Mean, Min and Max
|
Mean sea surface temperature (in Degrees Celsius). |
Mean Sea Surface Salinity |
Mean sea surface salinity, measured in PSU, where PSU is the Practical Salinity Unit measuring the ionic salt concentration in sea water (1 PSU is equivalent to 1g/kg). |
This information service had to be developed in a way that could be deployed via a number of channels, including web services and direct ingestion into GIS software. In order to deliver this information service, it was clear that a web map that allows users access to these features as a series of layers was the most appropriate.
SeaSpace adopted the Web Map Tile Service (WMTS) standard as it provided for good cartographic control of how the features were displayed, both on their own and in conjunction with other features. In addition, it also offered the best option in terms of performance. Given that user had reported finding existing web map services for marine data very slow, we wanted to show this didn’t need to be the case.