
News
COINAtlantic’s service reliability indicator
- Detalles
- Categoría: News News
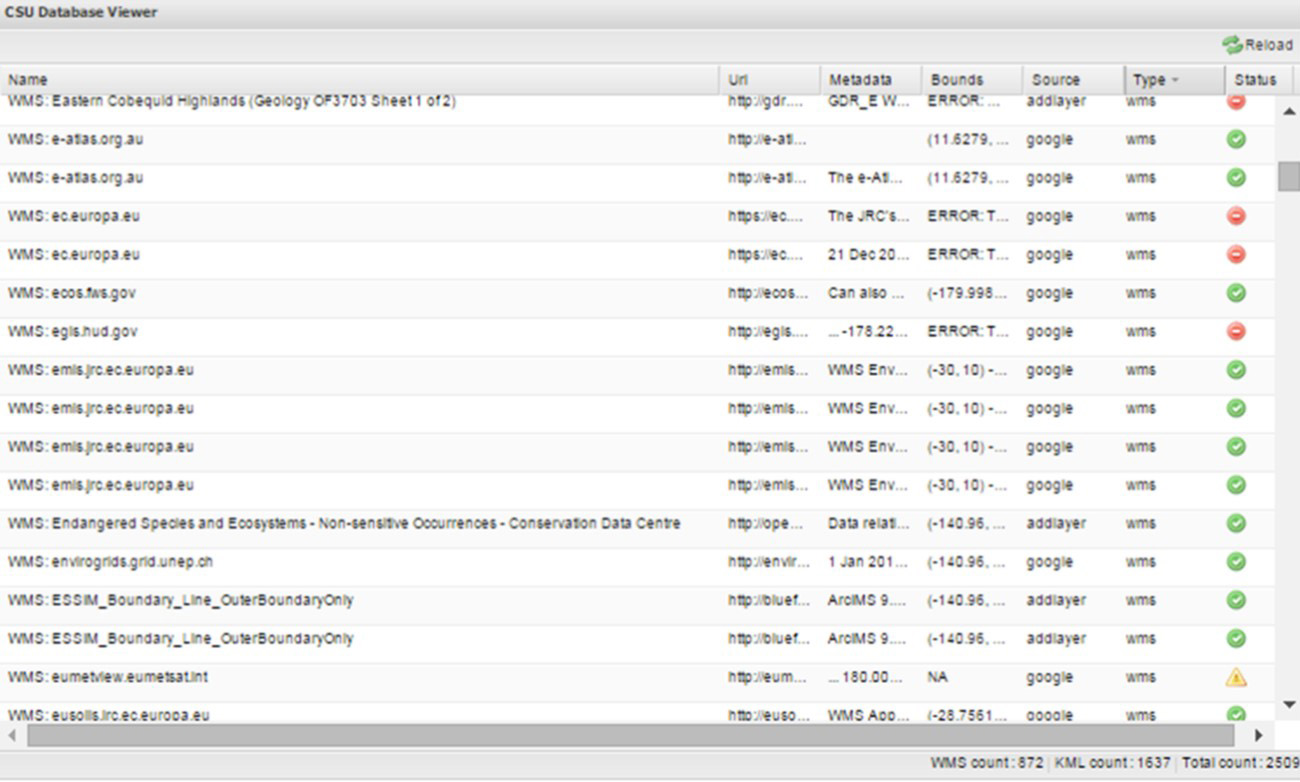
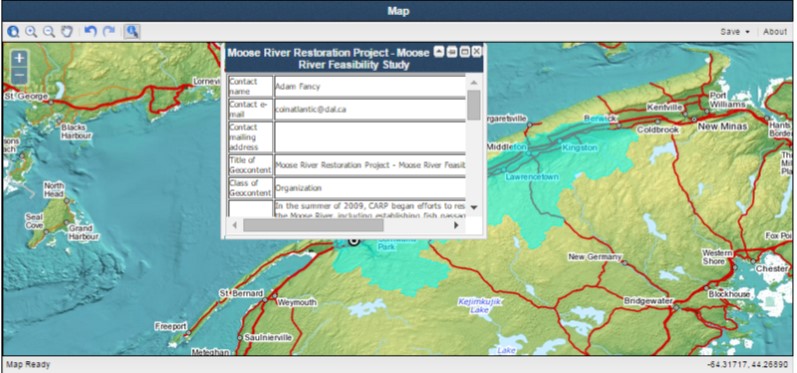
COINAtlantic has introduced a local database viewer to its Search Utility (CSU) web-based application. Each result of a user’s search for WMS and KML resources using the Google Custom Search API or a user’s addition of a WMS layer using the “Add WMS Layer” widget is stored in a local PostSQL data base. A script has been developed to interrogate each of the resources on a daily basis and store the geographic bounds of the KML or the WMS layer. If the interrogation successfully returns the geographic bounds, a green status symbol is displayed in the CSU database viewer (see below). If the interrogation was successful but the bounds were not returned a yellow symbol is returned. A red symbol is displayed if the service did not respond. This capability is a precursor development to support reliability indicators displayed in the CSU user interface and will enable geographic searches of the local data base.
MEDIN Linked Wrecks Pilot Study
- Detalles
- Categoría: News News
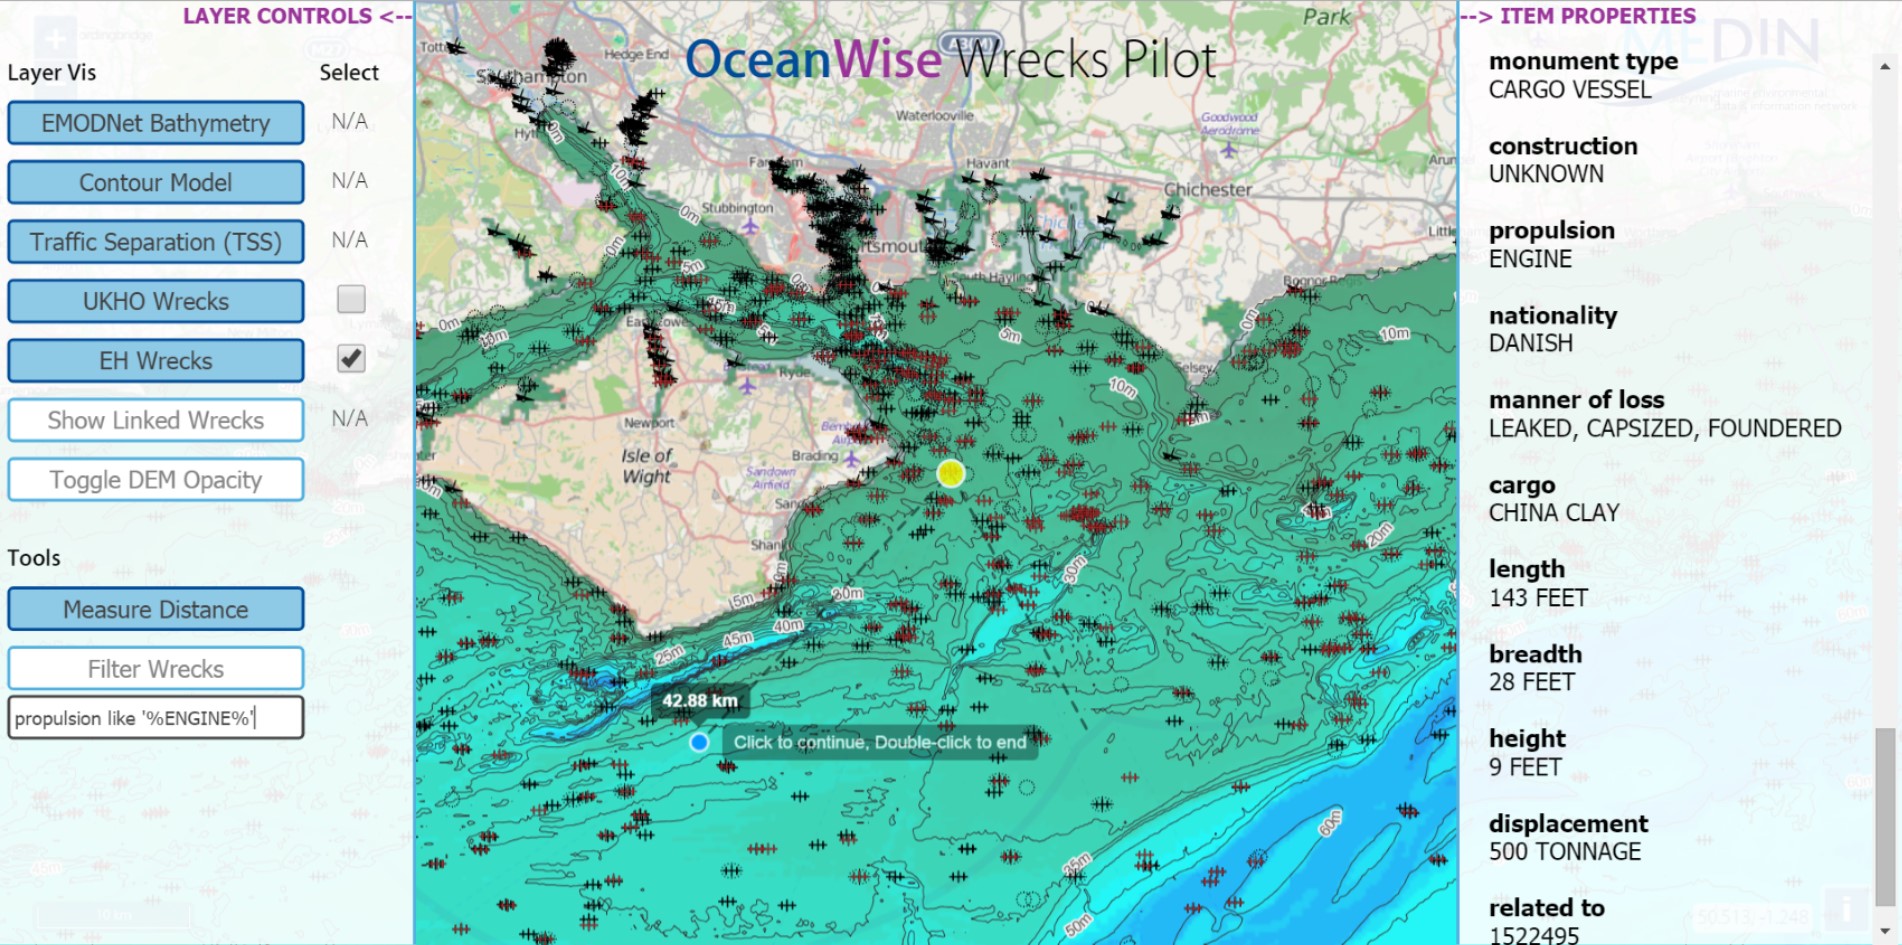
OceanWise has delivered to MEDIN (Marine Environmental Data & Information Network) a pilot study showcasing the ability to link wreck features across multiple discrete datasets and publish resultant information via the internet. The study aimed to utilise data from MEDIN DAC's (Data Archive Centres) which was then ingested to a relational database or data-mart before publishing both the original datasets and the linked datasets via OGC compliant web services. Datasets were linked where foreign key identifiers were present to match duplicate features and represent the links spatially.
A focus was placed on delivering the functionality using easily accessible OpenSource software and tools and ensuring that good data management practices were upheld throughout. This meant that data would be stored once using an OpenSource relational database and utilised within the project through various “views” or virtualised layers. Not only does this minimise the data storage overhead but also results in the process to update the entire project consisting of loading one update file per source dataset (two in total).
The web service layers were tested independently against a typical EIA (Environmental Impact Assessment) use case scenario by MarineSpace. For this, OceanWise produced a web map application that allowed basic analysis and view functionalities. For detailed analysis, WMS and WFS services were supplied that could be consumed by a standard desktop GIS. The benefit of visualising the join between matched features in different datasets through a spatial context can be seen immediately and is even more powerful when the user is able to combine the layers with their own thematic and base mapping information.
A detailed report was produced that explained objectives and methodologies in full. It also made recommendations to DAC's regarding the way datasets are structured and supplied and to OceanWise regarding the provision of the web services and web application offerings. Although there has been significant progress already made to create linked identifiers to be able to join duplicate features, there is still work to be done to address issues in the uncertainty of the spatial location of wreck features across different datasets. This is something that the linked map display helps to visualise and quantify.
The report will be published by MEDIN in the near future and points towards improvements where spatial data provided by MEDIN DACs can be accessed conveniently by specialists and non-specialists and used within a variety of platforms with ease.
New Educational and Interactive Tool Highlights New York’s Diverse Land and Offshore Resources
- Detalles
- Categoría: News News
Jeff Herter at Esta dirección de correo electrónico está siendo protegida contra los robots de spam. Necesita tener JavaScript habilitado para poder verlo.
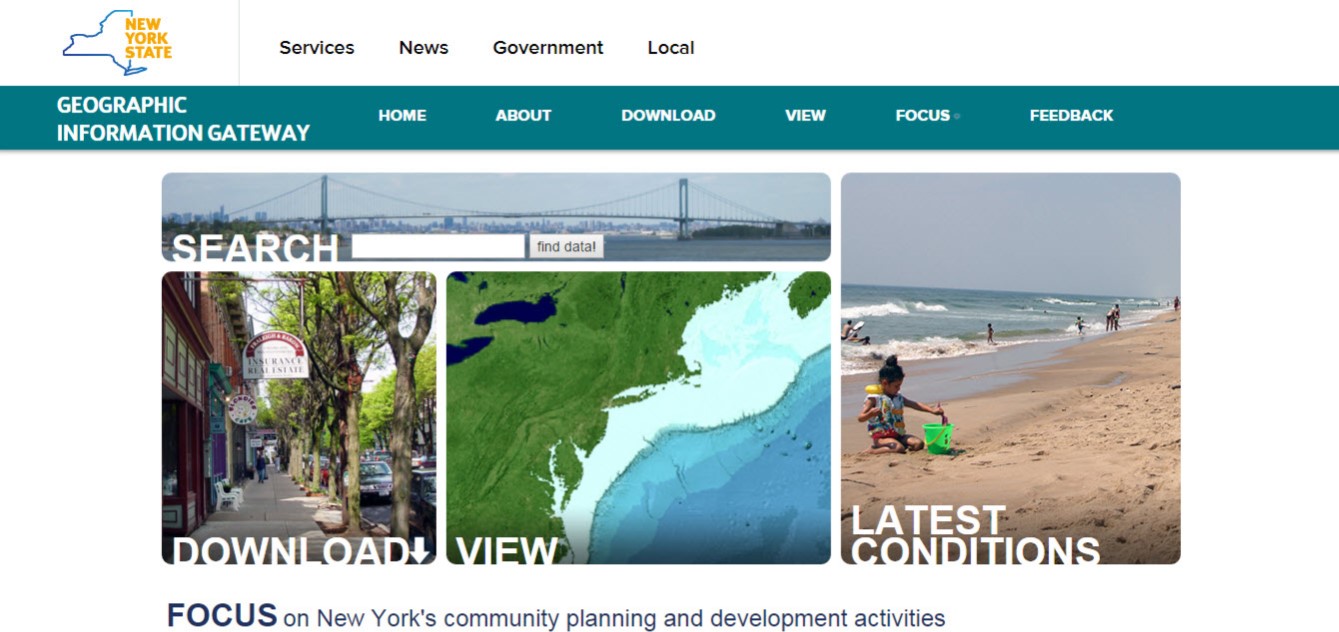
The New York Department of State today launched an educational and user-friendly website that identifies New York’s diverse land and offshore assets so residents, local governments, educators, businesses and others can use this information when making planning and development decisions. The website provides the public access to free and reliable geographic data, real-time information, interactive tools, and expert knowledge on New York’s resources, including climate change and community resilience activities.
The announcement comes during Climate Week, which Governor Cuomo proclaimed from September 22-29 to raise awareness about the challenges we face with a changing climate and to highlight New York’s actions to increase resiliency and curb emissions as global leaders meet in New York City this week.
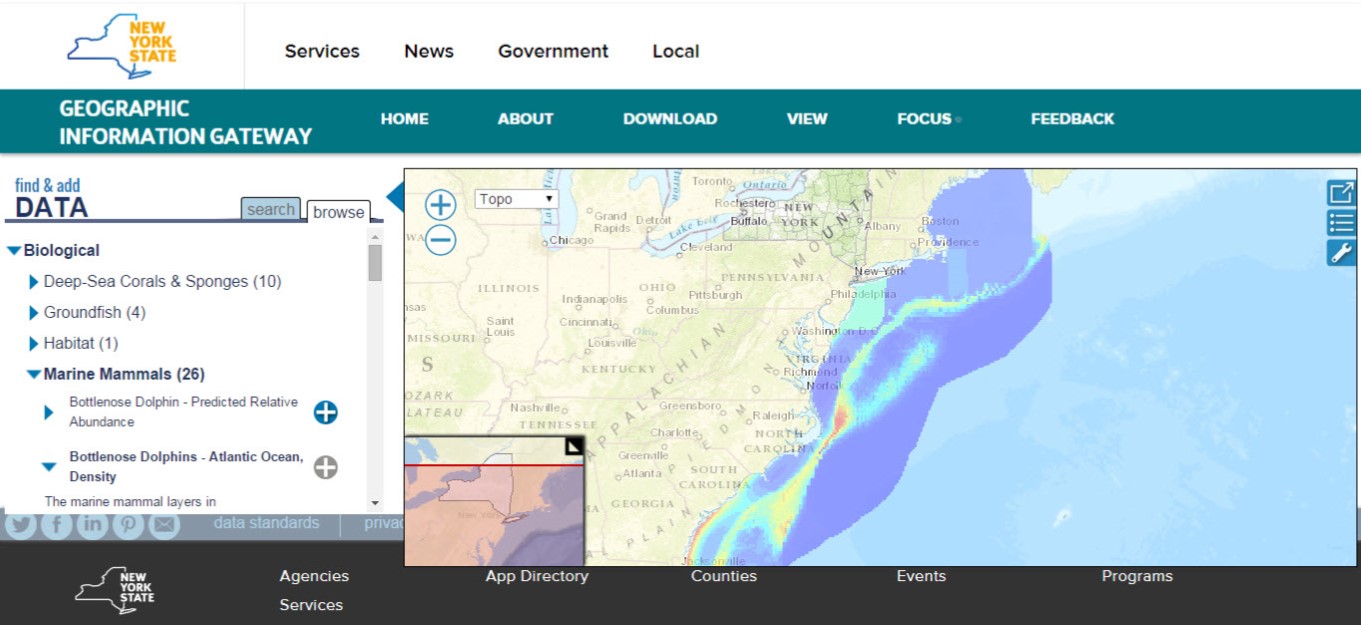
The website, the Geographic Information Gateway, or the Gateway, features state-of-the-art map viewing and contains cutting-edge interactive stories that highlight case studies, showcases community success stories, and illustrates how geographic information is collected, analyzed and used to improve planning and decision-making. The site also includes information on the potential effects of climate change and New York State’s proactive work with local governments to advance planning efforts that would ensure communities are prepared for severe weather events and sea-level rise.
Quotes
- “Now local governments and businesses have a user-friendly and comprehensive tool to identify important geographic information on the state’s water resources that will assist them in their planning decisions,” said New York Secretary of State Cesar A. Perales. “Our State’s economy, in part, is tied to its ocean, lakes and waterways, assets that provide countless commercial and economic opportunities for New Yorkers, as well as recreational opportunities for both residents and tourists.”
- “This new website identifies, categorizes and organizes New York State’s resources to aid a variety of audiences when planning and developing for the future,” stated Sandra Allen, Deputy Secretary of State, who oversees the Office of Planning and Development. “Users have access to the State’s planning and development activities, as well as guidance on resilience measures to protect us against storms, hurricanes and other natural disasters, which is one of the Governor’s top priorities.”
- “This new website identifies, categorizes and organizes New York State’s resources to aid a variety of audiences when planning and developing for the future,” stated Sandra Allen, Deputy Secretary of State, who oversees the Office of Planning and Development. “Users have access to the State’s planning and development activities, as well as guidance on resilience measures to protect us against storms, hurricanes and other natural disasters, which is one of the Governor’s top priorities.”
Audience
A variety of audiences and constituencies can benefit from the easily accessible information that is readily available on the Gateway:
-
Residents
- Determine if they live in an area susceptible to flooding by viewing Coastal Risk Areas in the map viewer.
- Find real-time information across the State describing beach conditions, tide levels, and coastal wind speeds and direction.
- Determine whether their community participated in the NY Rising Community Reconstruction program and access community reconstruction plans to better understand the implications of the plan to their daily lives.
- Determine if they live in an area susceptible to flooding by viewing Coastal Risk Areas in the map viewer.
-
Business Owners/Investors/Entrepreneurs
- Use the map viewer to quickly identify the Regional Economic Development Council (REDC) area of interest and access relevant REDC plans to understand how their activities relate to regional goals and strategies.
- View and download data that show the distribution of existing ocean uses and natural resources to help offshore wind developers anticipate and avoid conflicts and select the most appropriate areas for project development.
- Get-up to speed on New York State’s offshore wind planning efforts by reading the interactive story and reports available on the Atlantic Ocean page.
- Use the map viewer to quickly identify the Regional Economic Development Council (REDC) area of interest and access relevant REDC plans to understand how their activities relate to regional goals and strategies.
-
Local Governments
- Determine the level of flood risk a municipality or locale may face by viewing the Coastal Risk Areas overlaid on a satellite base map.
- Learn about the State’s resilience planning and explore nature-based approaches to managing shoreline erosion by reading interactive stories on the Climate Change and Resilience page.
- Learn about the resources and programs offered by the New York Department of State’s Office of Planning and Development to support community and regional resilience activities.
- Determine the level of flood risk a municipality or locale may face by viewing the Coastal Risk Areas overlaid on a satellite base map.
-
Educators
- Use the content and functionality provided by the Gateway to develop interactive lesson plans, such as demonstrating the potential effects of sea level rise on their students’ school, community and region.
- Explore different adaptive measures to address the future challenges of sea level rise and introduce their students to unique deep-sea life by exploring the submarine canyons found offshore New York.
- Use the content and functionality provided by the Gateway to develop interactive lesson plans, such as demonstrating the potential effects of sea level rise on their students’ school, community and region.
Benefits
Other benefits offered by the Gateway include:
- A user-friendly interface that increases government transparency by providing public access to geographic information.
- Enables the public to view and download over 400 datasets related to the Atlantic Ocean and community resilience planning activities, including all the data presented in the New York Department of State Offshore Atlantic Ocean Study.
- Custom-built stories that help visitors interactively explore and understand a diversity of topics, from offshore wind planning activities to the development and application of coastal risk areas to support community resilience planning.
- Real-time updates to facilitate data sharing between local, state, regional and federal partners and serves as a central platform hosting DOS’s state, regional and federal partner’s geographic data.
The Office of Planning and Development has held webinars in October to introduce users to the Gateway and familiarize them with the site’s many capabilities.
COINAtlantic introduces a new version of its GeoContent Generator (CGG)
- Detalles
- Categoría: News News
The CGG is a web-based tool for capturing basic metadata on an organization, project, publication or data set, links it to a spatial entity (i.e. polygon, line, or point), creates a KML file and facilitates its discovery on the internet by the Google search engine. The new version replaces the sequential process with a tab based interface that allows the user to easily move back and forth through the steps. It also makes more prominent the spatial entity capture step with the map always visible in the interface.
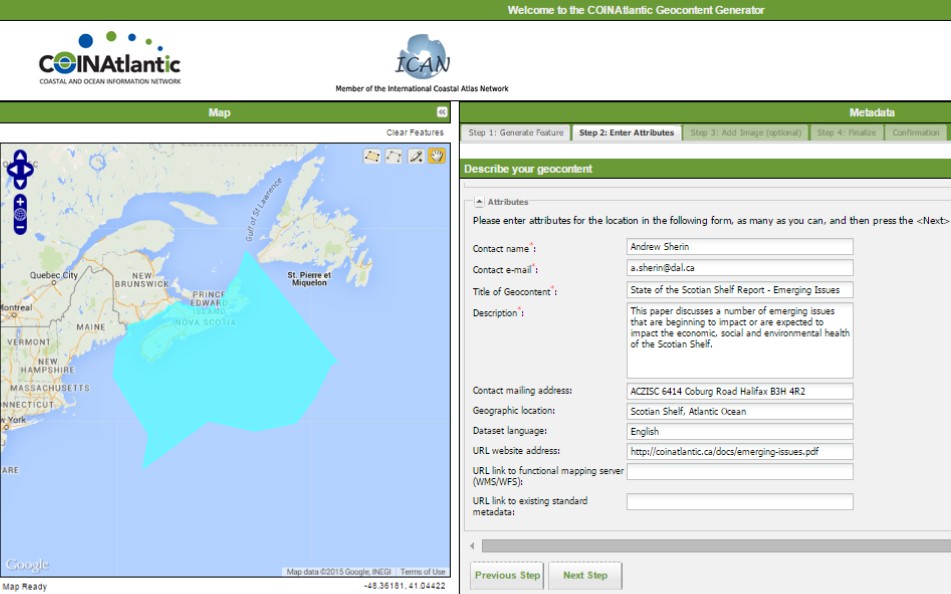
Other enhancements include the capability of entering a specific latitude and longitude coordinate as the spatial entity and uploading photographs to be included in the KML file. The CGG was designed to provide small organizations with a capability of making their data and information more visible on the internet. The CGG works together with the COINAtlantic Search Utility (CSU) that searches the internet for WMS and KML spatial data resources, including the KML’s built with the CGG and displays these resources on an interactive map. The CGG is available at http://www.marinebiodiversity.ca/coin/cgg/ and the CSU at http://www.marinebiodiversity.ca/coin/csu/
Is the information generated by coastal web atlases useful in costal policy and decision-making?
- Detalles
- Categoría: News News
by Shelby McLean, Dalhousie University, Halifax, Canada
With over 10,000 km of coastline, Nova Scotia is undeniably a coastal province. Numerous activities occur within the coastal zone making it a highly valuable area for many Nova Scotians. For this reason, numerous stakeholders are involved with studying and making decisions about various aspects and activities that occur in the coastal zones around the province. Some of these activities include: fishing, tourism, coastal development, efforts to support coastal biodiversity, shipping, and economic development. A sizeable body of research, completed by a wide variety of stakeholders, is generated regarding how these activities affect the coastal zone. However, currently, Nova Scotia has no single data management tool to bring all its coastal and marine information together. Effects from activities that occur within the marine realm are not independent of one another. For example, a particular fishing area may overlap with a whale watching tour as well as a shipping lane. Therefore, collecting information generated from various coastal activities into a single management tool could increase communication among stakeholders, as well as, strengthen policy development processes.
Studies on the dissemination of information have found that managers and other information users place a high value on data visualization in decision-support systems. Furthermore, mapping tools have been specifically highlighted as useful in information dissemination. Digital coastal atlases are publicly available web-based interactive mapping tools, which display different layers of GIS-based data. Many jurisdictions worldwide have implemented coastal atlases (approximately 40 coastal atlases exist) and they are thought to be effective for information dissemination and planning, particularly in policy and decision-making contexts. Therefore, the aim of this research was to investigate the usefulness of coastal atlases as data management and decision support tools in jurisdictions where they have been implemented, i.e., are coastal atlases proving to be useful for data management as well as coastal policy and decision-making? Results from this research were expected to help inform the Nova Scotia government about whether to pursue the implementation of a provincial coastal atlas.
Methodology
Initially, a literature review was conducted, which provided guidance for detailed semi-structured interviews. Four different digital coastal atlases in four jurisdictions were selected for this study: Maryland, Massachusetts, Scotland, and British Columbia. The atlases were selected based on recommendations from the Nova Scotia Department of Fisheries and Aquaculture (NSDFA), a governmental research partner to the Environmental Information: Use and Influence (EIUI) program, the availability of individuals who use the atlases for interviews, and because the atlases represent jurisdictions in Canada and other countries, thereby providing breadth to the study.
Interviews of approximately 45 minutes were completed with four coastal web atlas developers and 18 users. Atlas users were a combination of government and non-government employees. The users were asked questions about: their backgrounds, their use of atlases generally, their use of the atlases in decision-making contexts, their views about the atlas they used, and their recommendations regarding the ongoing development of the atlases. Atlas developers were involved with the creation, implementation, and maintenance of each of the four digital coastal atlases. They were asked questions about the rational for creating each atlas, data maintenance of the atlases, their observations about atlas users, and lessons they learned in building and maintaining the atlases. All of the interviews were audio recorded and then transcribed and thematically coded by hand. The analysis of the transcripts involved several tasks: immersion in the data, coding the data, creating categories from the coded data, and identification of key points or themes that were discussed in the report (Bazeley, 2007; Green et al., 2007; Ryan & Bernard, 2003)
Results
At a general level, every user and developer interviewed found their respective coastal web atlas helpful for a variety of different reasons. One user stressed that it would be impossible to complete occupational responsibilities if the digital coastal atlas did not exist. All of the users were aware and used their respective atlases showing that coastal atlases are helpful in government, non-government, and consulting sectors. Furthermore, every user and developer stated that they would recommend their respective atlas to a variety of other users, which confirms that the atlases are helpful and the interviewees think others would find them useful as well.
This research aimed to determine whether coastal atlases are proving to be useful for data and information management, as well as coastal policy and decision-making. With regard to the former, all of the atlas users stated that their respective coastal web atlases allowed them to access a diverse range of information and twenty-two percent of these respondents stated that the atlases also enlightened them about information that they did not know previously existed or was accessible. One goal of information management is to collect and manage information from a variety of sources and distribute that information to one or more stakeholders. Similarly, the purpose of digital coastal atlases is to make many types of information accessible to wide user bases in easy to understand and visual formats (O’Dea et al., 2011). The responses of the participants in this study suggest that coastal web atlases are effective for managing large quantities of geographic data and information.
With reference to the question about whether coastal web atlases are useful in coastal policy and decision-making, the literature stated that they can be used to inform a wide variety of marine-related policies and decisions related to climate change, population pressures, coastal hazards, resource management, and hazard assessment (O’Dea et al., 2011; Wright et al., 2011). The interview findings mirrored the literature as many participants (50 percent) stated that using a coastal web atlas allowed them to be more confident about their decisions, as they were able to access a large volume of credible data in a centralized location. Thirty-eight percent of users believed that because the data in the coastal web atlases are publically available and thus transparent they were able to communicate their decision-making processes to the public more easily.
One indicator for determining if information is useful is whether it enables policy makers to achieve desired outcomes. The users were asked if a coastal atlas enhanced their ability to make decisions and almost all stated that the respective atlases allowed them to not only achieve their desired outcomes but the atlases actually enhanced their ability to make decisions. Their views on this point indicate that the information in the four coastal web atlases aided them in their work, particularly because using a coastal atlas increased their confidence in decision-making as noted above. A third of the users believed that the open access nature of the data increased transparency in decision-making and over half stated that the atlases enhanced their ability to make decisions more efficiently because it saved them time. In relation to barriers to policy-making, the users’ responses show that coastal web atlases help to overcome barriers many decision-makers face in making evidence-based decisions. Users were asked if they believed that the information in the atlases was both credible and current. Ninety-four percent of users believed that the information was current and 88 percent thought the information was credible, adding further evidence that coastal web atlases contain a wide variety as well as worthwhile information.
The evidence assembled in this study makes it clear that a digital coastal atlas could help to resolve the data management challenge found in Nova Scotia. The province can call on the experience of over 40 coastal web atlases globally, not just the four studied in this project (Rideout, 2014). Nonetheless, the four atlases provide ample evidence for Nova Scotia to proceed with creating a digital coastal atlas. Development and launch of a publically accessible coastal web atlas would provide a substantial decision support tool to aid numerous stakeholders managing coastal areas.
Recommendations
The following recommendations should be taken into consideration when planning the development of a coastal web atlas.
Concrete goals and priorities: When conceptualizing a major project like a coastal web atlas concrete goals and priorities should be outlined, namely, why the tool will be created, what will be gained from implementing a digital coastal atlas, what is the timeframe for completion and initial launch of the atlas, how will priorities be set with regard to the information that will be included in the tool, etc.
Understanding of audience/user group: As the developers interviewed in this study stressed, a clear understanding of the audience or users is crucial. The users of a coastal web atlas will ultimately decide if it is relevant. Therefore, it is important to determine their needs prior to implementing the tool. Their needs could be established by soliciting their input about the features or data they would like to see in the tool.
Iterative and incremental development: Coastal web atlas development should be incremental and iterative and following each stage, intensive testing should be completed by the anticipated users. Assessment helps developers to understand what refinements (technical and data related) should be completed to ensure that the atlas remains user friendly.
High quality metadata: Developers and users repeatedly emphasized the necessity of high quality metadata. When data are loaded into a digital coastal atlas, corresponding high quality metadata should be included at the same time. High quality or full metadata allows users of the atlas to determine the source of the data and ultimately be confident in its credibility.
Comprehensive cost analysis: Funding is important for any management project, especially a long-term initiative like a digital coastal atlas. Funding is required throughout the development and implementation of an atlas and maintenance also requires financial resources. A couple of the developers interviewed in this research implied that they are currently unable to update and maintain their respective atlases to the standards they prefer because of limited funding. Therefore, a comprehensive cost analysis, which includes long-term funding for maintenance and updates not just development and implementation of a coastal atlas, should be prepared.
Highly qualified atlas administrator/custodian: Lastly, a highly qualified administrator/data custodian should be chosen, as this person will be responsible for ensuring that the atlas continues to be updated/user-friendly. This individual can be tasked with addressing user concerns and comments, which will ensure that the atlas meets the objectives it was created for and responds to innovations as additional data is included and the underlying technology evolves.
References
- Bazeley, P. (2009). Analyzing qualitative data: More than “identifying themes.” Malaysian Journal of Qualitative Research, 2(2), 6-22.
- Green, J., Willis, K., Hughes, E., Small, R, Welch, N., Gibbs, L., & Daly, J. (2007). Generating best evidence from qualitative research: The role of data analysis. Australian and New Zealand Journal of Public Health, 31(6), 545-550.
- O’Dea, E. K., Dwyer, E., Cummins, V., & Wright, D. J. (2011). Potentials and limitations of coastal web atlases. Journal of Coastal Conservation, 15, 607-627.
Ryan, G. W., & Bernard, H. R. (2003). Techniques to identify themes. Field Methods, 15(1), 85-109. - Rideout, E. (2014, May). EIUI coastal atlas project description. Unpublished report.
- Wright, D. J., Cummins, V., & Dwyer, E. (2011). Coastal informatics: Web atlas design and implementation (pp. 1-11). Hershey, PA: IGI Global.
- Note: This is a summary of a Master of Marine Management research project report completed in December 2014. The full report is available at this link http://dalspace.library.dal.ca/handle/10222/56205