News
Meteorological drought in the Digital Climatic Atlas of Mexico
- Detalles
- Categoría: News News
by Agustín Fernández Eguiarte
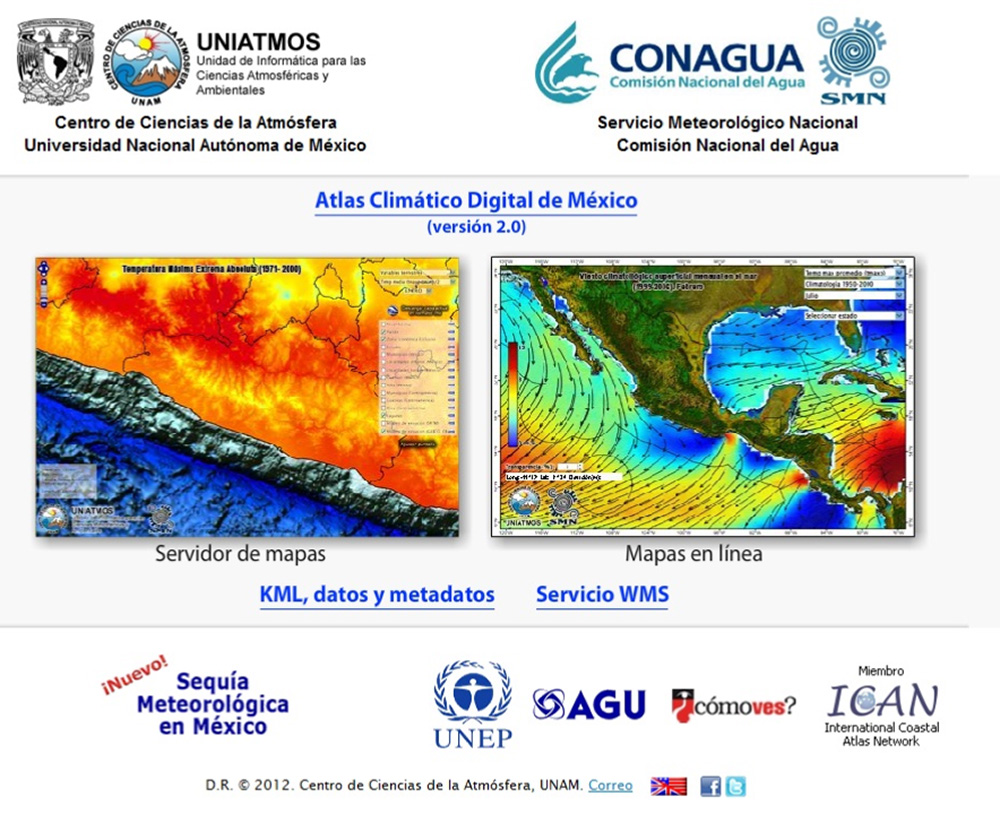
The new version of the Digital Climatic Atlas of Mexico (DCAM) includes the meteorological drought thematic using advanced technological tools and new methodologies for the cartographic processes that include the quality control of the data and the display of interactive maps in the Internet.
With the aim of generate and integrate in version 2.0 of the DCAM the cartographic displays of continental basic climatic variables (temperature and precipitation), bioclimatic parameters, extreme climatology and meteorological drought periods in Mexico, the data of over 5,200 meteorological stations were processed from the daily climate databases (1902-2011) of the Mexican Weather Service (abbreviated to SMN in Spanish) of the National Commission of Water (CONAGUA). This was done as part of a joint project between the SMN and the Informatics Unit for Atmospheric and Environmental Sciences (UNIATMOS) of the Center for Atmospheric Sciences (CCA) of the National Autonomous University of Mexico (UNAM).
The drought in Mexico
The meteorological drought is an atmospheric phenomenon that occurs when the precipitation in a region, and during a determined period, is lower than the reference average established from measurements in a typical 30-year period. If the decrease of the precipitation is severe and goes on for extended periods, then the type of drought that impacts agriculture and hydrology is generated, which is characterized by the negative effects on the economic sector of the region or directly to people in the affected communities. The drought in Mexico is one of the natural phenomena that more severely affects the economy, since large cultivated areas and livestock are lost when it happens.
The main cause of the drought is the lack of rain; however, there are factors that contribute to generate it such as changes of the general circulation of the ocean-atmosphere system related to alterations in the sea surface temperature, to changes in the atmospheric pressure and to increases in the carbon dioxide concentrations, among others. The Drought Fascicle by García F., Fuentes O. y Matías L. G., (2002), published by the National Center for Disaster Prevention (CENAPRED) of the Mexican Government, incorporates a historic review of the droughts that occurred in Mexico, including the months and places where it happened. The drought periods which are registered and documented in this publication are: 1998-2000, 1993-1996, 1970-1978, 1960-1964 and 1948-1954.
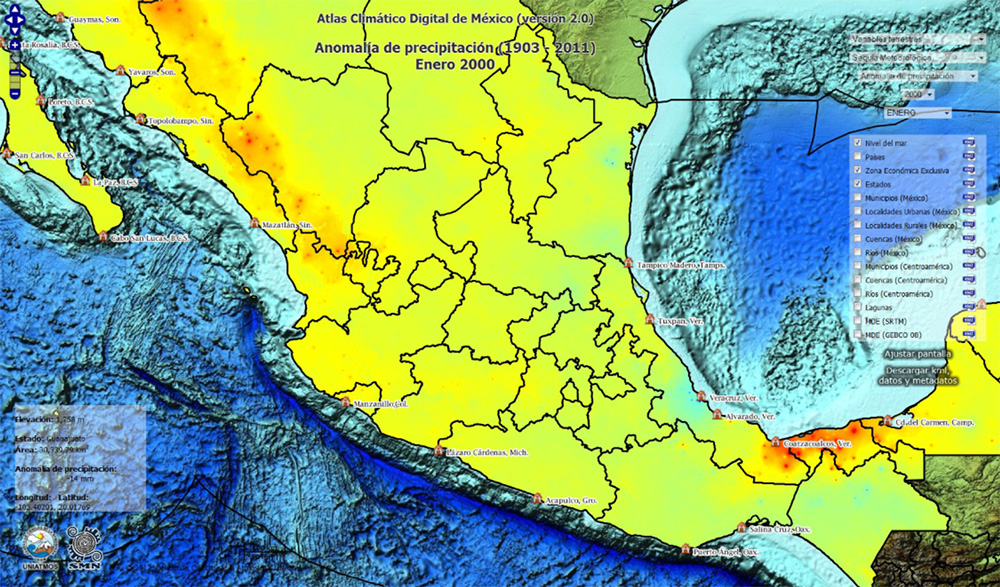
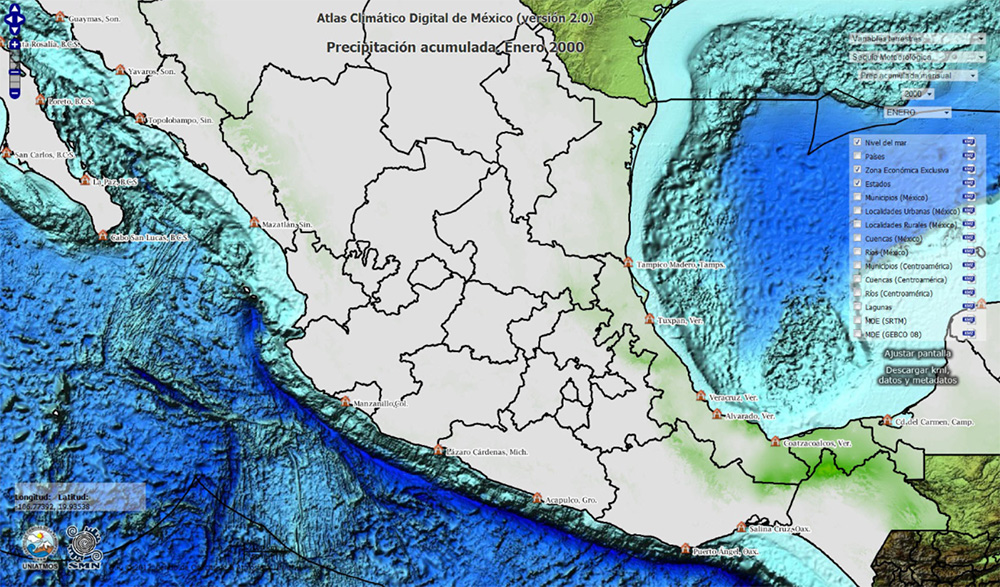
From the daily climatic data base of the SMN, that includes information for the period 1902-2011, and according to the methodology described in the DCAM documents (http://atlasclimatico.unam.mx/atlas/uniatmos.html) on the processing of climatic surface maps, and the quality control of the continental climatic information and its validation, the monthly accumulated precipitation (see figure 1) was calculated for the Mexican Republic corresponding to the months impacted by drought that are reported in the above mentioned publication, as well as its respective anomaly, which is the difference between the accumulated precipitation during a given month, for example, January 2000, and the average accumulated precipitation of all the Januaries of the period 1902-2011 (see figure 2).
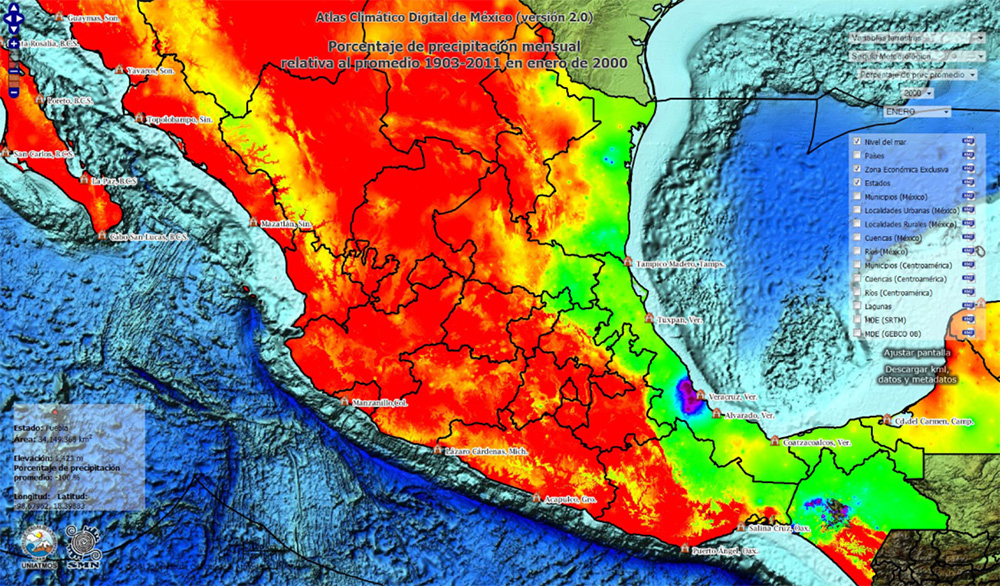
Afterwards, the obtained anomaly was normalized and a monthly map of the percentage of accumulated precipitation with respect to the average of the reference period 1902-2011 was created (see figure 3). In this map, it is possible to consult the rain percentage that have occurred above (positive) or below (negative) the historic average in any location, so that the meteorological drought may be visualized, quantified and evaluated in all the states and municipalities of Mexico.
Currently, there are 213 maps of meteorological drought processed. These maps were generated at a very high spatial resolution (926 m), taking into account the topographic effect. The information is available through the “Map server”, “Maps online”, “KML, data and metadata” and “WMS Service” options of the DCAM (see figure 4). (http://uniatmos.atmosfera.unam.mx).
Marine, coastal and continental climatology
The DCAM provides users with inter-institutional information on climate, extreme climatology, climate change, droughts and bioclimatic parameters for the continental zone; also, sea surface temperature, chlorophyll-a concentration, climatological surface winds, absolute dynamic topography, sea level anomaly and geostrophic velocity over the ocean, as well as sea level in the coastal zone.
Additionally, the DCAM is a platform that allows to display and visualize the maps in an interactive mode, and offers decision-makers the quantitative elements to submit proposals that contribute to design new policies towards the reduction of vulnerability and the increase of adaptation capabilities to face the climate change and disasters linked to natural hazards in different geographic regions, as well as in the costal, agricultural and hydraulic sectors.
The “Map Server” component of the DCAM allows the visualization of thematic maps with different approaches. Specific information may be requested regarding the cartographic compositions displayed, and it is even possible to combine the thematic display of any map with reference information such as municipal, state and national boundaries, as well as hydrologic basins, rivers and lakes of Mexico and Central America. Urban and rural localities, as well as the Exclusive Economic Zone of Mexico and the countries located in the geographic area covered by the Atlas may also be incorporated. The Digital Elevation Models Shuttle Radar Topography Mission (SRTM) and General Bathymetric Chart of the Oceans (GEBCO) serve as topographic and bathymetric base for the above process.
The “Maps online” option allows a faster visualization of integrated maps and also to obtaining climatic information in any geographic location, to compare thematic layers in a clear and quick way, and to do transparencies of the thematic layers with the topography, which, in this case, comes from data of the Advanced Spaceborne Thermal Emission and Reflection Radiometer (ASTER).
The maps of the DCAM may be consulted in KML (Keyhole Markup Language) format, to be displayed and complemented with all facilities of the Google Earth system. Also, the data and metadata of the thematic maps may be downloaded freely and at no cost. Finally, the maps can also be accessed through the “WMS Service” (Web Map Service).
North Carolina COHAZ Decision Portal Conveys Critical Data and Useful Mapping Products
- Detalles
- Categoría: News News
At left is a montage of coastal hazard images which is explained on the web site: http://www.coastal.geology.ecu.edu/NCCOHAZ/
J.P. Walsh1,2, Reide Corbett1,2 and Tom Allen1
1- East Carolina Univesity
2- UNC Coastal Studies Institute
The coast of North Carolina is at risk to a diversity of hazards (e.g., storm surge, sea-level rise), and these hazards potentially can have major consequences (financial and otherwise) for people who live, work, and recreate in impacted areas. There has been much research conducted on coastal hazards affecting North Carolina and their ramification, but information is scattered and often hard to track down. Also, it is typically not in a form suitable for public consumption. To improve on these issues, a team of researchers from the departments of Geological Sciences and Geography at East Carolina University (ECU) has worked with others at ECU and around the state to develop a web-based information site on coastal hazards and related research; it is called the North Carolina COastal HAZards (NC COHAZ) Decision Portal. At the site (http://www.coastal.geology.ecu.edu/NCCOHAZ/), a variety of information on coastal hazards in the state (particularly the northeastern portion) has been coalesced.
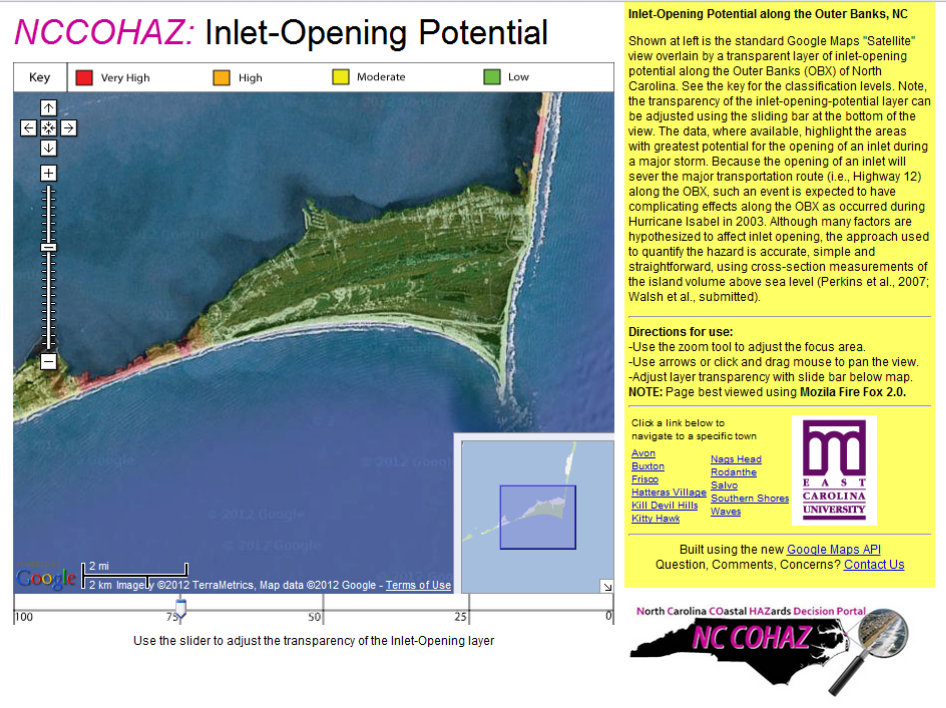
Visitors to the web portal are welcomed by a colorful banner at the top of the web page (Figure 1). On the main entrance page, “news bytes” are regularly updated using an integrated blog; these short pieces communicate interesting hazard-related stories or information and usually feature a photograph, map or video. The “Maps and Visualizations” page provides links to a variety of tools and products on topics such as current hazards, shoreline erosion and inlet-opening potential (Figure 2). Several user-friendly mapping tools have been created to allow researchers, managers and the public to explore maps of immediate or potential hazards (e.g., sites of flooding, strong winds, large waves). The approach used for presentation and validity of some of the tools can be argued (e.g., erosion projections). Nevertheless, the creators believe it is better to have this information out and available where it can be considered, rather than hidden in hard-to-find journals or difficult-to-obtain reports.
Please take some time to visit the NC COHAZ Decision Portal. The developers have a variety of ideas on how to expand the site, such as plans for a more formal marine atlas. But, if you have any suggestions or thoughts on information contained on the site or data you would like to see added, etc., do not hesitate to contact J.P. Walsh, Esta dirección de correo electrónico está siendo protegida contra los robots de spam. Necesita tener JavaScript habilitado para poder verlo., (252) 328-5431. Feedback of any kind is appreciated. Hopefully, this site will improve communication and information on coastal data exchange around the state and beyond. Ultimately, the goal of NC COHAZ is to help mitigate the effects of coastal hazards on the citizens of North Carolina, and this can only be accomplished through better sharing of knowledge, data and ideas.
Coastal and Marine Information System of Andalusia (Spain) - Environmental Information Network of Andalusia
- Detalles
- Categoría: News News
by Alejandro Iglesias Campos, Esta dirección de correo electrónico está siendo protegida contra los robots de spam. Necesita tener JavaScript habilitado para poder verlo.
Government of Andulsia / Regional Ministry of the Environment
Preparing a new atlas interface to be online soon!
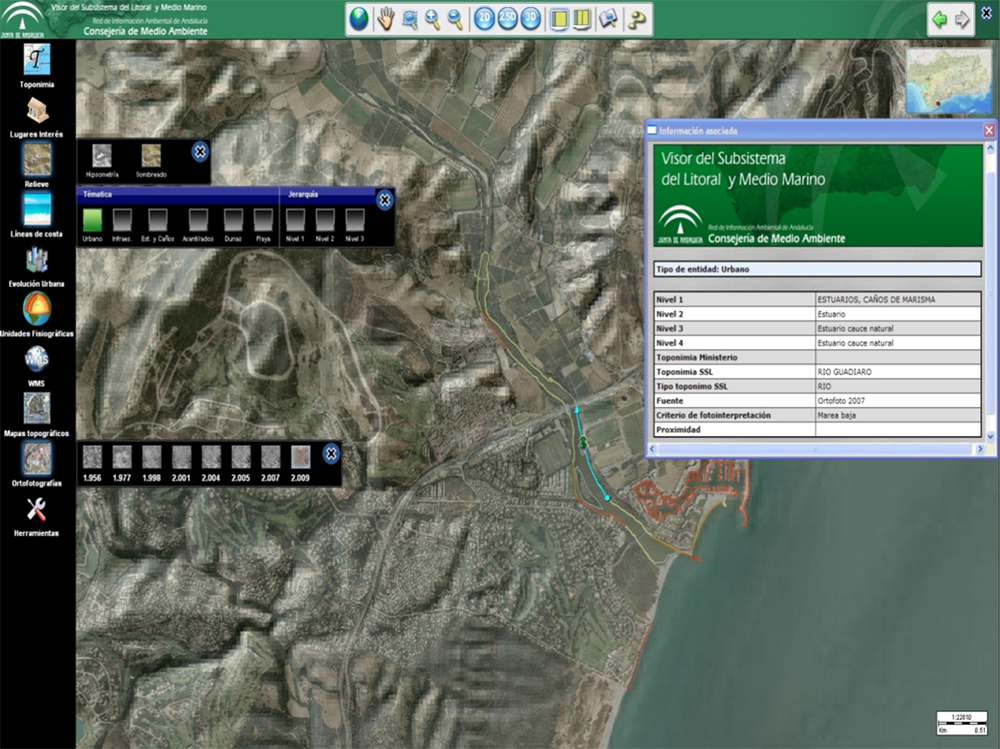 The Environmental Information Network of Andalusia (REDIAM) will publish during 2012 a new coastal and marine atlas in Spanish and English with new functionalities and new contents. The new atlas interface will make easier all kind of search by citizens and technician using the Coastal and Marine Information System of Andalusia in their daily work.
Looking for new projects with our Portuguese colleagues!
The Portuguese Geographical Institute and the Environmental Information Network of Andalusia (Spain) together with other partners from the Mediterranean have applied to the European Neighborhood Policy Instrument Call with the AgoraMedGIS Project to promote the sustainable and integrated planning and management of marine and coastal zones in the Mediterranean Basin, making available universal access to data and geographic information and improve knowledge, the sharing of information and articulation between stakeholders. AgoraMedGIS - Marine and Coastal Mediterranean Basin Information System, is based on the "Ágora" concept, symbol of ancient Greece direct democracy. "Ágora" was the place where the citizens use to meet and share and discuss ideas and issues that were important to all. In this sense, the tool that will be developed by the partners allows the searching for multidisciplinary information that exists about a certain place, enabling the user to filter it accordingly to his own interest or focus, or selecting data by project type, activity or thematic area and related to the Mediterranean Basin in general or to specific zones. AgoraMedGIS will transform the entire Mediterranean basin in a small village in the domain of data.
Erosion rates 1956 – 2007 in our sandy beaches!
The erosion rates constitute a very valuable indicator for understanding coastal dynamics and its effects produced by river regulations (mainly by damming them) and the construction of coastal infrastructures.
In this sense, negative erosion rates (regressive coast) show more vulnerability; and positive erosion rates (progressive coast) show less vulnerability. After calculating the erosion rates for the entire Andalusian coast during the periods 1956-1979 and 1979-2007, some stretches have been chosen and validated as being of special interest due to the intensity in coastal dynamics: the coast of Huelva, the beaches/barrier of the mouth of the San Pedro river, Velez river delta, Guadalfeo river mouth, Adra-Albuñol and Huarea rivers, as well as the coast of Campo de Dalias.
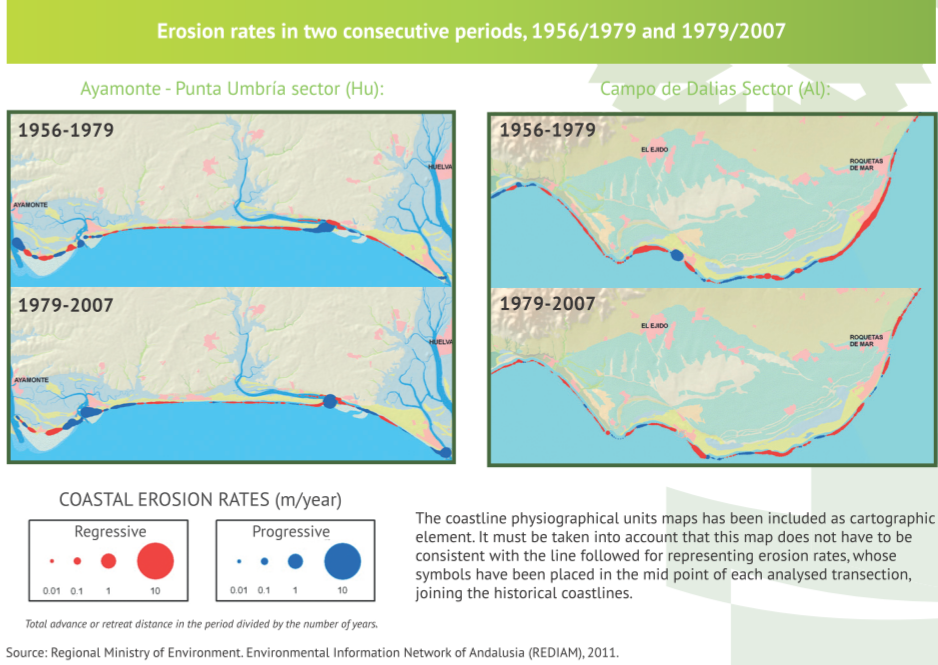
The first sector, located between the Huelva cities of Ayamonte and Punta Umbría, is characterised by having to highly changing zones at the mouth of the Guadiana and at the end of the Flecha de El Rompido and Flecha de Punta Umbría. In the sector between Mazagón and the mouth of the Guadalquivir river there is the beach and moving dunes complex of the Doñana National Park, one of the most characteristic examples of coastal progradation in Andalusia. On the other hand, the mouth of the Guadalquivir river is the most active stretch in this sector, reaching the positive rates of 10 m/year in the period 1956-1979 and up to 19 m/year in the period 1979-2007. In the province of Cadiz, in the beaches/ barrier of the mouth of the San Pedro river, it is worth remarking that the building of an industrial and port area altered completely the dynamics of the zone, which went from positive rates in the period 1956-1979 to erosion rates of up to -16 m/year in the period 1979-2007.
In the Mediterranean coast, at the mouth of the Velez and Guadalfeo rivers, there are two cases of deltas formed previously to the built-up of river mouth channels, which results in a general regression in almost all the stretches of both sectors.
The delta of Albuñol and Huarea rivers is different to the previous example, as the channelling of the mouth took place after 1956, and it does not have dams. For this reason an important progradation is shown in the first period.
The case of the Adra river, in the province of Almeria, is a “double delta” resulting from the artificial deviation of the original bed before 1956, which results, except in the oriental sector between 1956 and 1979, in negative rates in both periods. Finally, the case of the Campo de Dalias sector is highly singular, mainly because it is a stretch that receives no direct sedimentation from important river beds or watercourses. This, together with the urban growth of the 70’s, with the construction of ports and with the extraction of sand for greenhouses, has contributed to the fact the coast is, in both periods, mostly erosive.
Maryland’s Coastal Atlas Undergoes Face-lift and Rolls Out New Tools for Informing Coastal Planning and Decision-Making
- Detalles
- Categoría: News News
By Jeff Allenby and Chris Cortina
Maryland’s Chesapeake & Coastal Service (CCS) is improving the State’s ability to access coastal data and tools that will help inform decision-making about coastal management with Maryland’s Coastal Atlas. This online mapping and planning tool, developed to allow users to visually analyze and explore data for coastal and ocean planning activities, has recently undergone a number of exciting updates and enhancements that are slated for launch in March 2012.
 Originally launched in June of 2008, the Coastal Atlas represented a significant overhaul from the Maryland Shoreline Online mapping portal supported by the Department of Natural Resources’ Chesapeake & Coastal Service (CCS). Sparked by Governor O’Malley’s enthusiasm for GIS technology as a tool for improved transparency, accountability, and communication, the Coastal Atlas was developed shortly after the roll out of Maryland iMap – a centralized collection of the most commonly used Maryland data layers, tools and services hosted in an ESRI ArcGIS Server environment. Maryland iMap makes these layers, representing the best data available to the public for free, accessible as web services so state and local governments don’t have to store or host data while ensuring the layers look the same across all state mapping applications. Following the lead of the earliest Maryland iMap applications (like GreenPrint, AgPrint and StateStat), the Coastal Atlas was developed using ArcGIS Server and Adobe Flex technology allowing state and local officials to access the data/web services they want to display.
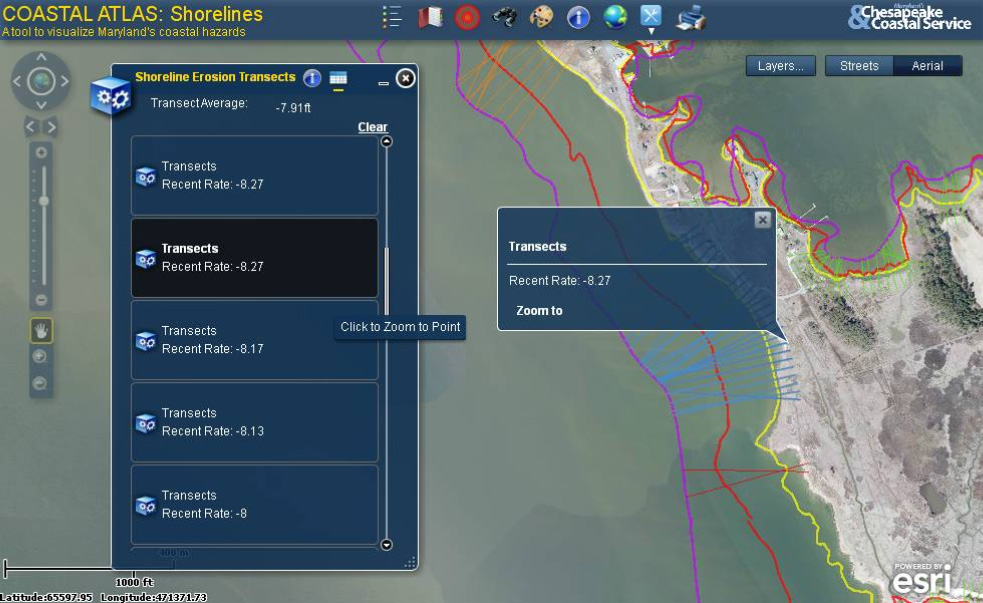
From October 2010 through March 2012, through funding from Maryland’s Coastal Zone Management grant and with the help of developers/programmers at Towson University’s Center for GIS and Maryland Environmental Service, CCS staff has worked to enhance the functionality and utility of the Coastal Atlas. A major overhaul to the Atlas’s three mapping applications (Ocean, Shorelines, and Estuaries) has allowed the addition of new tools that enhance the user experience and allow for easier modification to include future enhancements.
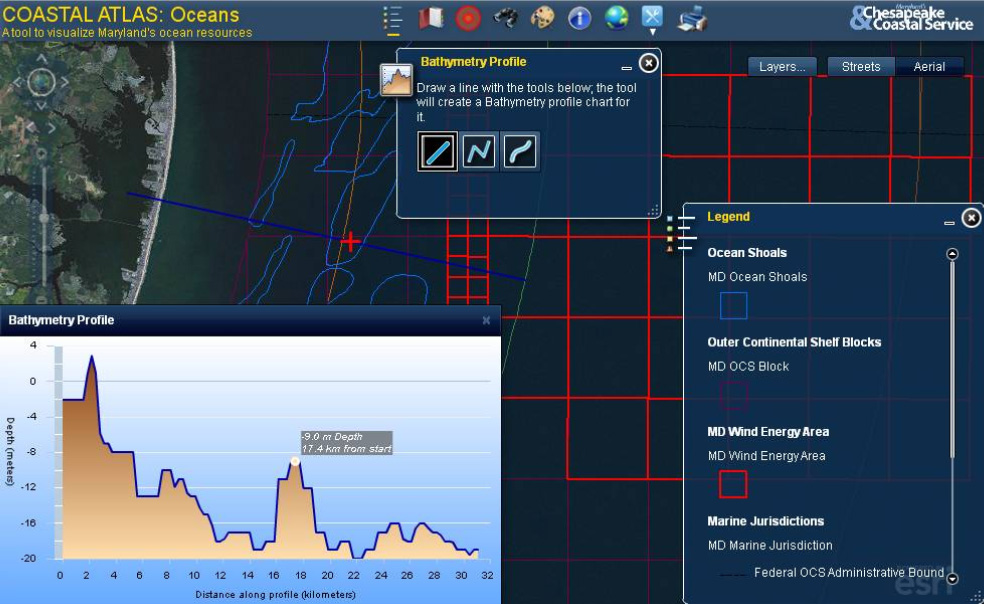
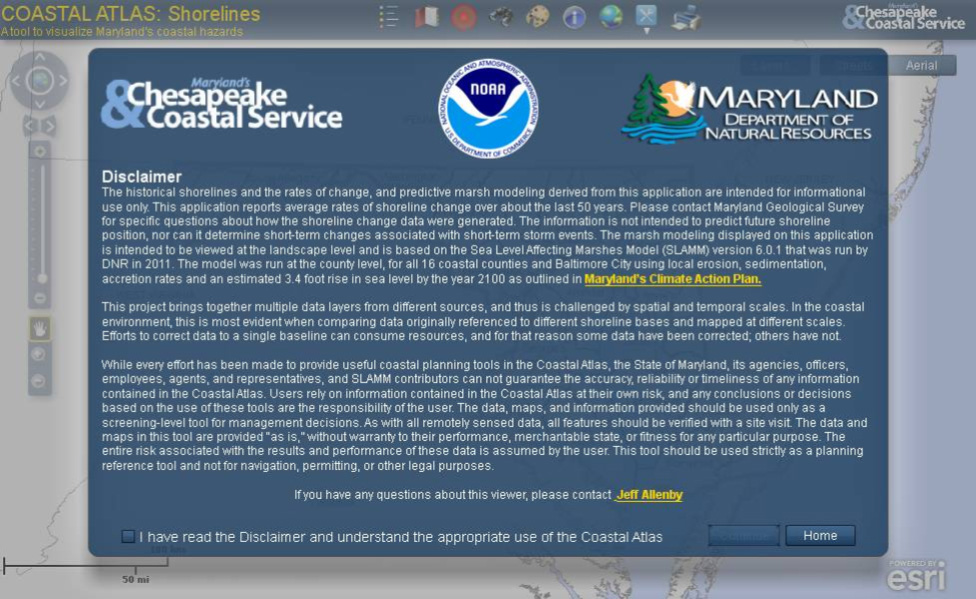
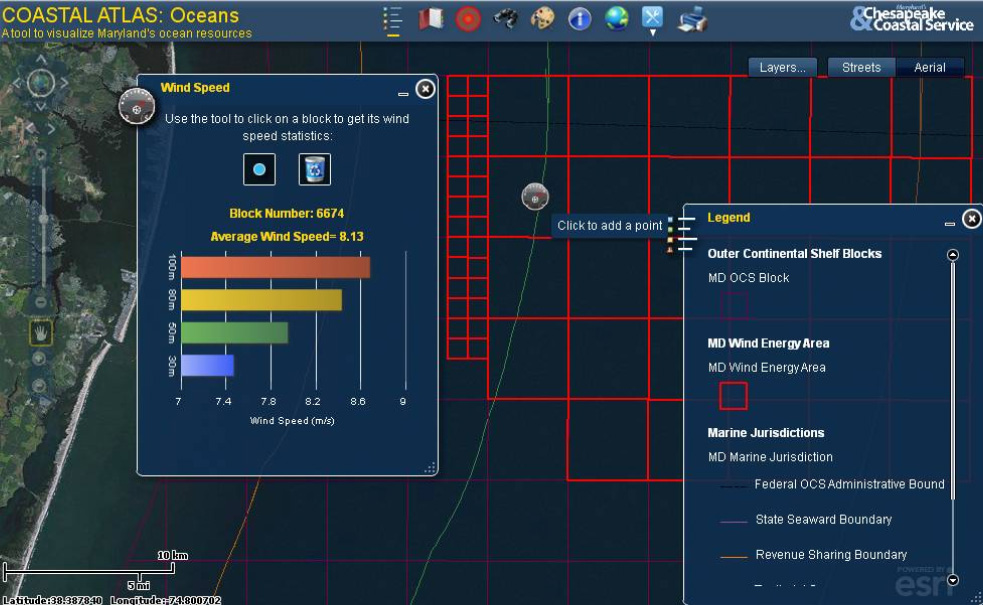 The most noticeable enhancements to the Coastal Atlas are to the overall look and feel. The Atlas applications were updated to the FlexViewer 2.5 template and a uniform user interface was created for all three applications (see photo). The new interface allows for better organization of tools and icons clearing up valuable map space, contributing to an overall better experience. Other enhancements worth highlighting include: the creation of the Add Mapservice widget, which allows users to import custom mapservices as well as import, from pre-defined lists, any layer from the other Atlas applications; addition of the eDraw widget (developed by Robert Scheitlin) allowing users to choose the size, color, font and emphasis of text labels for drawings as well as the ability to save and load these drawings for future sessions; a revamp of the existing Identify tool that allows the user to choose between identifying from all layers or from a specific layer - increasing the ability of the end-user to select only pertinent information while decreasing the “clutter” of the old Identify results; creation of a new CBNERR Sites widget to display location and links to basic information on Chesapeake Bay National Estuarine Research Reserve Sites; creation of a new CELCP widget to display location and basic information about sites acquired through the Coastal and Estuarine Land Conservation Program (property name, year established, acreage, project type); development of an “Offshore Wind Roses” widget which displays a small image of a wind rose diagram and link to larger image; and the adaptation of an “Elevation Profiles” widget (developed by Mark Deaton) that was modified to show bathymetric profiles along user selected paths of either a straight line, polyline, or freehand line.
 The remainder of the updates and enhancements were of the general housekeeping variety, taking advantage of the FlexViewer 2.5 template and new user interface to more intelligently organize tools, icons, and buttons in the available mapping space and to optimize the overall user experience. Examples include:
- Developed a Splash Screen to display disclaimer information when each mapper is opened;
- Removed the Layer List widget and replaced it with the “Layers…” button next to the Map Switcher. Also incorporated increased functionality to adjust layer transparency, move each layer forward or backward in the map, and access metadata;
- Created a consistent user interface for all three mappers where the widget icons are all the same, in the same location, with the same instructions;
- Placed all custom geoprocessing tools in a dropdown menu located in the widget tray to clean up the user interface as well as to allow for a consistent user experience between applications despite the geoprocessing widgets being unique to each mapper.
- Utilized the Export Map widget (developed by Robert Scheitlin) to replace the existing Print widget. This widget allows the user to export a map to .jpg file, which can be used in presentations or documents, instead of just printing it;
- Updated the “About” window to include information about our program and to include contact information and links to important websites; and
- Revised and created custom geoprocessing widgets that automatically turns a specific layer we wanted to highlight on and off when the widget is opened or closed and allows the user to view information about them.
 In addition to the Atlas face-lift, CCS has created a more comprehensive
For more information on Maryland’s Coastal Atlas visit http://dnr.maryland.gov/ccp/coastalatlas/index.asp or contact Jeff Allenby with Maryland’s Chesapeake & Coastal Service at Esta dirección de correo electrónico está siendo protegida contra los robots de spam. Necesita tener JavaScript habilitado para poder verlo.. Those interested in learning more about Maryland iMap and other mapping tools developed by the State should visit: http://www.imap.maryland.gov/portal/.
The Marine Irish Digital Atlas goes from strength to strength
- Detalles
- Categoría: News News
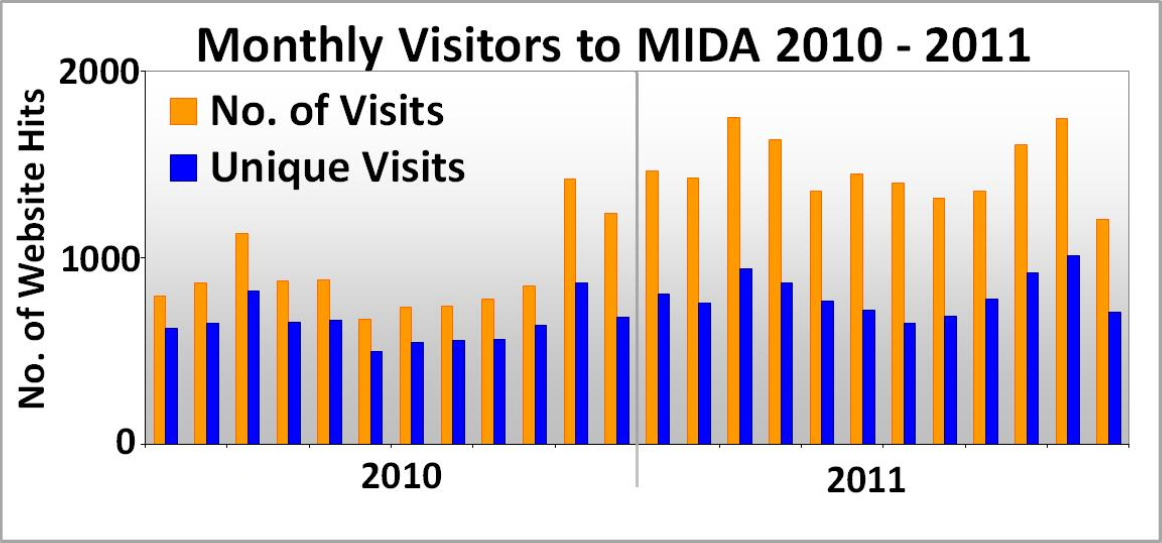
The Marine Irish Digital Atlas (http://mida.ucc.ie) launched in 2005 is still increasing its user base. The figure shows how the total number of visits and the number of unique visitors increased into 2011. This is due to the ongoing effort of the MIDA team to ensure that the data in the atlas is up-to-date and that new data layers are being constantly added. This is in no small part due to the work of Ivan Portugues Molla and Hector Barco both of whom contributed to MIDA under funding from the EU’s Leonardo da Vinci programme, which offers graduates the possibility to get relevant work experience outside of their home country in another EU State.
A sunnier climate eventually called Iban and Hector back home to Spain and while we miss them greatly, we are delighted to welcome David Roig Cervera, who started a MIDA internship under the European Socrates Erasmus programme in March 2012. This year is shaping up to be equally exciting as Coastal and Marine Research Centre, University College Cork, Ireland (CMRC) received funding from IODE for a MIDA facelift and technology upgrade, and subsequent transfer of this technology package to ODINAFRICA. The ODINAFRICA-IV project will use this technology for Coastal Web Atlas development and upgrade in many coastal countries of Africa contributing to the African Marine Atlas.