
News
SeaSpace – Providing Satellite Data as a Marine Web Atlas
- Detalles
- Categoría: News News
Keiran Millard
Esta dirección de correo electrónico está siendo protegida contra los robots de spam. Necesita tener JavaScript habilitado para poder verlo.
SeaSpace is a marine atlas part-funded by the UK Space Agency, and was set up to address a particular aspect faced by marine and coastal users, namely how to consume information from large data sets (typically from earth observation missions and numerical models) – without having to download and process large binary data files?
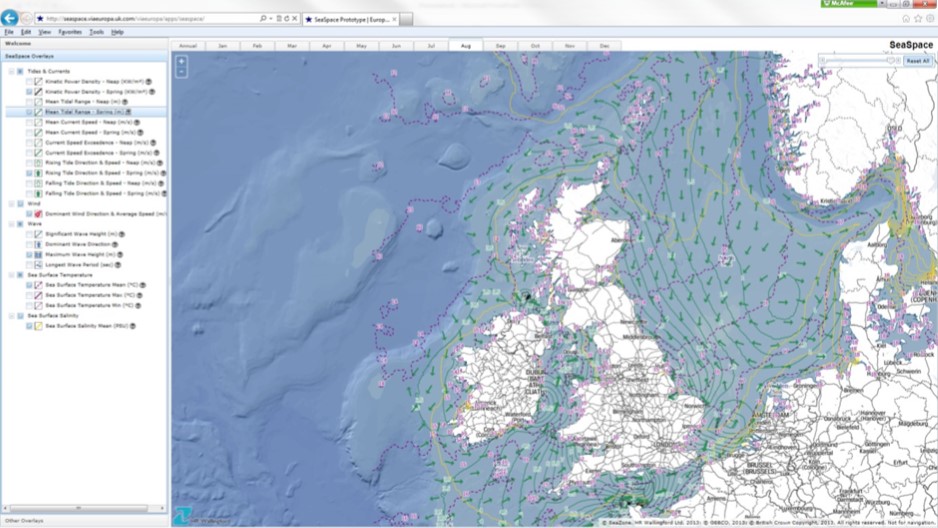
Users wanted a solution that was “like Google Maps” that provided a simple interface to communicate to them, in a meaningful way, what these large datasets contained. What’s been delivered is not just a standalone atlas, but a standards-compliant WMTS with an API enabling others to use the service.
SeaSpace is not a scientific challenge – the technology pieces exist, it’s about taking what exists and tailoring it to deliver the atlas—in particular large archives of marine data derived from earth observation missions, processing infrastructure for large datasets and standard web services that users are familiar with. Formally three objectives were addressed in SeaSpace:
- To exploit data across a range of different satellite missions observing the marine environment; advancing the uptake of existing missions and feeding back to the space community gaps in observing capability.
- To help bridge the gaps between publically funded services for processing earth observation data (e.g. GMES1 / ESA Due2) and the consumption of this data at the community level; establishing a persistent relationship between these communities.
- To introduce the Data as a Service (DaaS) concept and representation of earth observation data as explicit geographic Features Types, enabling the exploitation of existing data archives and ongoing missions.
From a technical point of view, the focus of the Sea Space project is about taking large and complex datasets and extracting specific information from them that conforms to definitions agreed within user communities. For the prototype SeaSpace atlas, the offshore renewable energy industry was adopted as a target user community. This goes somewhat against how data services have traditionally been delivered which is to adopt a ‘lowest common denominator’ approach. In SeaSpace we deliberately sought to process the data to maximize information available, irrespective about whether we were duplicating content. So, if the user would like maximum, minimum and mean of ocean temperature we would generate these statistics and present them as separate information. The parameters extracted for the trial atlas are shown in the table below:
Data layer |
Definition |
Kinetic Power Density |
The measurement of the mean hydrokinetic resource in KW/m2 for both the Neap (n) and Spring (s) cycles of an average 14.5day tidal period. The minimum economic threshold for site development is often considered to be around 1 KW/m2. For outstanding sites, the kinetic power density may exceed 5 KW/m2 |
Bathymetry |
Gridded bathymetric surface with spot height soundings. The requirement here was a batyhmetric surface that was “cartographically good”, providing a backdrop to multiple oceanographic features. |
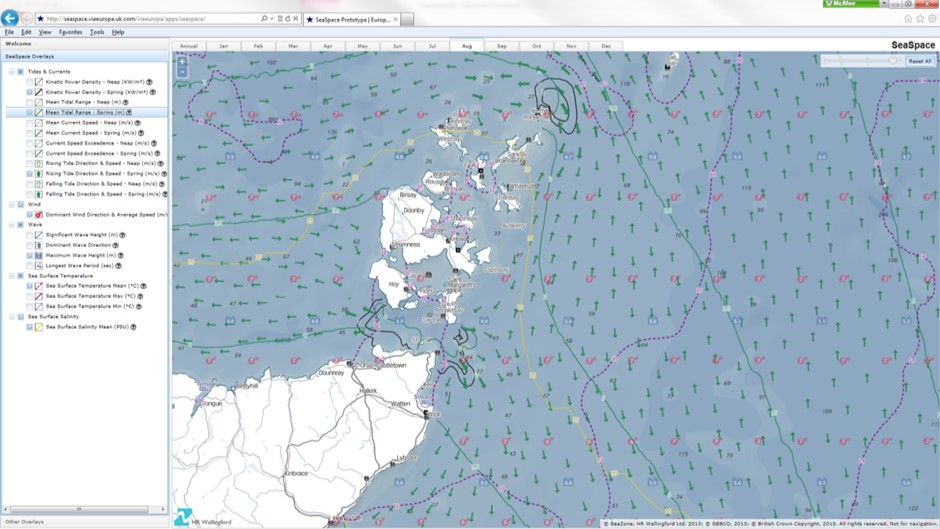
Mean Tidal Range |
The difference between high tide and the succeeding low tide, averaged over both the Neap (n) and Spring (s) cycles of an average 14.5day tidal period and measured in metres. |
Mean Current Speed |
The mean current speed (measured in metres per second) predicted for both the Neap (n) and Spring (s) cycles of an average 14.5day tidal period. |
Current Speed Exceedance |
The value of the current speed (measured in metres per second) exceeded 10% of the time in the 14.5day tidal period. |
Rising Tide Direction & Speed |
Mean peak current speed (m/s) and corresponding direction of the rising/flood tide, calculated both for the Neap (n) and Spring (s) cycles. |
Falling Tide Direction & Speed |
Mean peak current speed (m/s) and corresponding direction of the falling/ebb tide, calculated both for the Neap (n) and Spring (s) cycles. |
Dominant Wind
|
Dominant wind direction and monthly average wind speed at 10m height above sea level (in metres per second) |
Mean Significant Wave Height |
Wave Height is defined as the vertical distance between the crest of one wave and the preceding trough and the Significant Wave Height is described as the mean height of the largest third of the zero-up-crossing waves. |
Significant Wave Height
|
The Significant Wave Height (in metres) that is exceeded 10% of the time. |
Dominant Wave Direction |
The most dominant wave direction measured in degrees. |
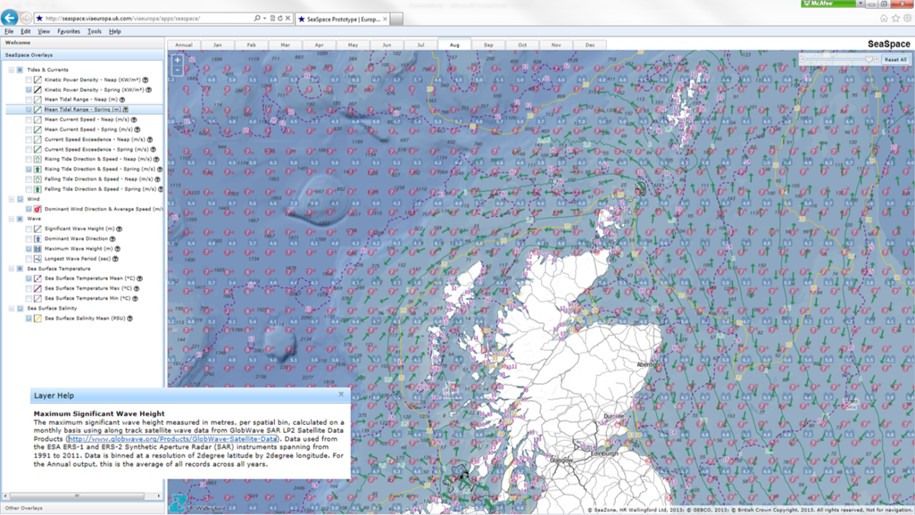
Maximum Significant Wave Height |
The maximum significant wave height, measured in metres. |
Longest Wave Period |
The longest wave period, defined as the longest time it takes two successive wave crests to pass a given point, measured in seconds. |
Mean, Min and Max
|
Mean sea surface temperature (in Degrees Celsius). |
Mean Sea Surface Salinity |
Mean sea surface salinity, measured in PSU, where PSU is the Practical Salinity Unit measuring the ionic salt concentration in sea water (1 PSU is equivalent to 1g/kg). |
This information service had to be developed in a way that could be deployed via a number of channels, including web services and direct ingestion into GIS software. In order to deliver this information service, it was clear that a web map that allows users access to these features as a series of layers was the most appropriate.
SeaSpace adopted the Web Map Tile Service (WMTS) standard as it provided for good cartographic control of how the features were displayed, both on their own and in conjunction with other features. In addition, it also offered the best option in terms of performance. Given that user had reported finding existing web map services for marine data very slow, we wanted to show this didn’t need to be the case.
Introducing the North Carolina Coastal Atlas
- Detalles
- Categoría: News News
Michelle Covi
East Carolina University
Esta dirección de correo electrónico está siendo protegida contra los robots de spam. Necesita tener JavaScript habilitado para poder verlo.
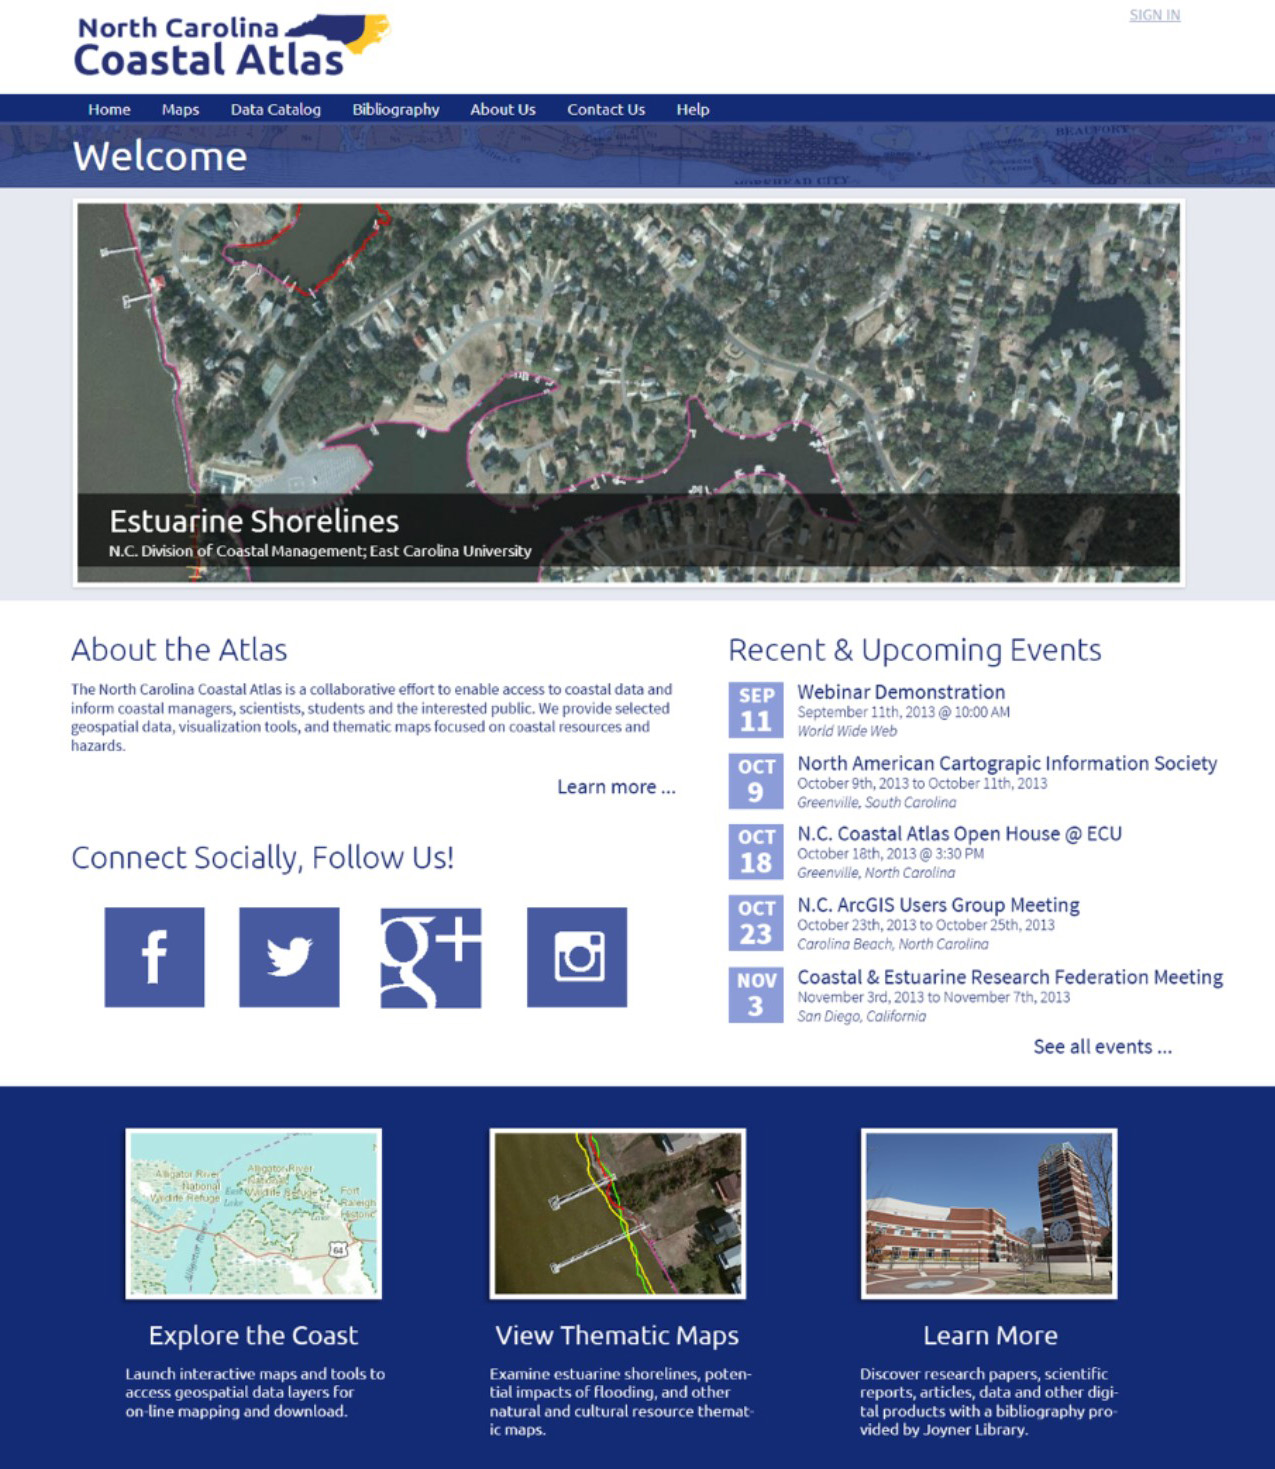
The North Carolina Coastal Atlas http://www.nccoastalatlas.org/ had its genesis when several East Carolina University researchers and state agency coastal managers came together to address some important coastal issues. Although North Carolina has a large amount of coastal resource data, it is located in many different agencies, universities and other organizations in a way that is not coordinated or integrated. The North Carolina Coastal Atlas provides users with a geospatial portal that will allow various data to be displayed, combined, analyzed and ultimately shared. With an emphasis on thematic maps which highlight data useful for specific user needs and a unique geo-referenced bibliographic search function, the North Carolina Coastal Atlas avoids duplication of services available on regional portals or through state agency services.
Thematic Maps
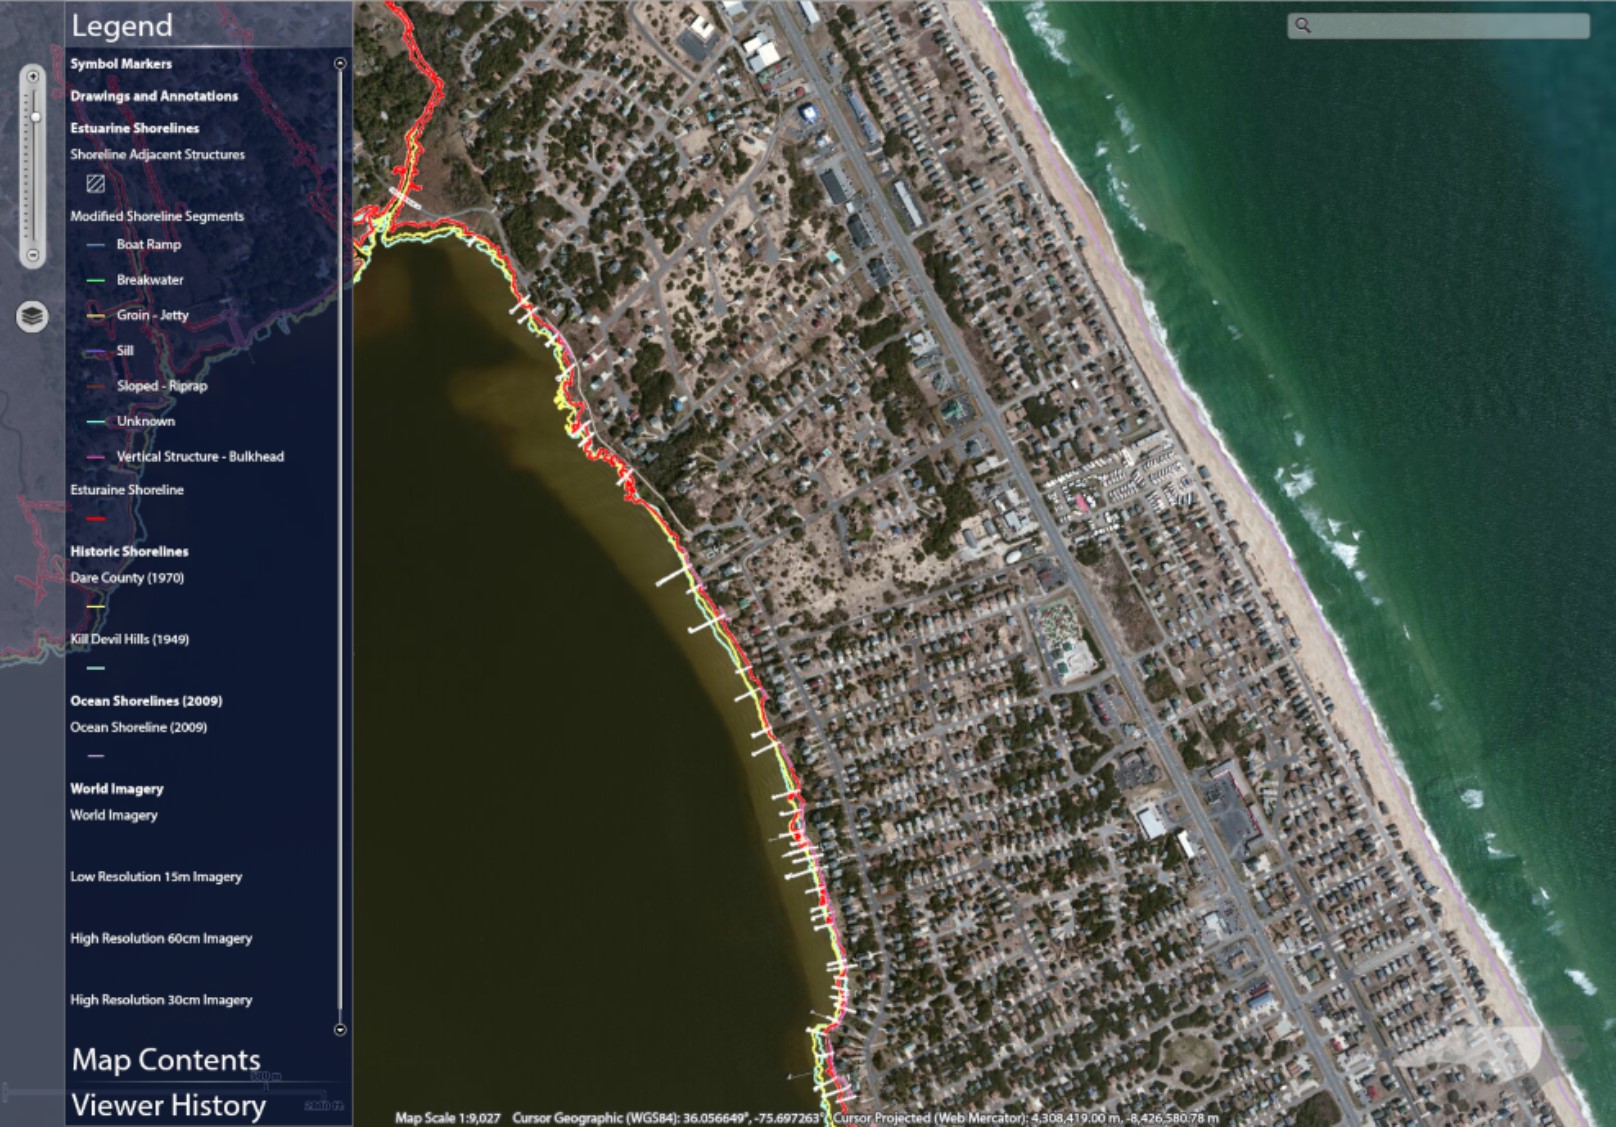
In 2012, the North Carolina Division of Coastal Management completed their first-ever continuous digital map of the estuarine shoreline in the state, mapping over 12,000 miles. The Estuarine and Ocean Shoreline thematic map located on the North Carolina Coastal Atlas provides access to this data with a custom viewer. Shorelines were delineated using heads-up digitizing from geo-referenced county-level aerial orthophotographs at a viewing extent of 1:300-1:500. Shoreline-adjacent structures were also inventoried, digitized, and attributed and are available within the atlas, including boat ramps, docks, breakwaters, groins, sills, riprap, and bulkheads. Coastal managers identified a potential use for shoreline and associated data within the atlas as a way to facilitate the permit application and review processes for coastal property owners. Users can identify their building site within the context of adjacent development and natural systems including wetlands and submerged aquatic vegetation. In the near future, the atlas user interface will allow the public to create a sketch of their building plan, showing all neighboring properties, water bodies, and required buffers. Once completed, sketches can be shared via URL or social networking sites. The permitting process can thus be streamlined and made clearer when both those requesting permits and those reviewing permits have access to the same information. The North Carolina Coastal atlas promises to facilitate such important, spatially-referenced communication.
The Wetland, Habitats and Threats thematic map focuses on the wetland management use case. The North Carolina coastal region has extensive and diverse wetland types given its low elevation lands with poor drainage and warm temperate climate. Wetlands play an important role in reducing water pollution, flood mitigation and habitat for wildlife, including nursery areas for important seafood species. Managers planning for wetlands protection or restoration need tools to help visualize both priority wetlands and potential threats to wetland stability or survival. The map uses the North Carolina Coastal Region Evaluation of Wetland Significance (NC-CREWS), a watershed-based wetlands functional assessment model, to categorize wetlands by significance. Threats visualized include coastal near-shore structures and the potential threat of sea-level rise, modeled using the Sea Level Rise Affecting Marshes Model (SLAMM) and the Marsh Equilibrium Model (MEMII). Future data layers will illustrate other potential threats to wetland habitat such as land use change and the locations of stream obstructions or water withdrawals.
The Flood Inundation Vulnerability map examines potential flooding of coastal communities and demonstrates the utility of maps to identify risk to coastal natural resources and selected municipal areas. In North Carolina, riverine flooding, urban flash floods, storm surges, and potential sea-level rise combine to increase flood hazard risk, especially in low elevation coastal flood zones. These maps combine flood zone data provided by North Carolina Emergency Management with local critical infrastructure data. Municipal water infrastructure such as fresh water intakes, municipal wells, pump and transfer stations, wastewater treatment plants and outfalls are frequently located at low elevation sites to use gravity to move water in the system whenever possible. Supply system infrastructure such as electric utilities, transportation and communication are critically important and also vulnerable to inundation in low elevation areas.
Bibliographic Reference Integration
The North Carolina Coastal Atlas integrates geotagged bibliographic information as a unique coastal atlas feature, which allows coastal researchers and managers to easily assemble geographically-limited literature reviews. The faceted search engine built upon Apache Solr allows type, time range, author and keyword searches. Bibliographic references are synchronized with Mendeley reference management software to assist users in organizing and sharing their custom bibliographies.
Collaboration
The North Carolina Coastal Atlas is produced by a team committed to sharing and promoting the use of coastal geospatial data and technology for education, broad public use and decision-making. The Atlas project is managed by a steering committee providing overall governance, standards and procedures, and data stewardship. The steering committee determines the design, data, and tools to offer end users, and is committed to the use of best practices for data management and accessibility for the public good. The Atlas is supported by grants and contracts from stakeholders and in-kind contributions from the North Carolina Division of Coastal Management (DCM), NOAA Center for Sponsored Coastal Ocean Research (CSCOR) and Cooperative Institute for Climate and Satellites (CICS), North Carolina Sea Grant, ECU Center for Coastal Informatics and Modeling (C-SIM), ECU Academic Library Services, ECU Center for GIScience, and UNC Coastal Studies Institute. Also participating in the collaboration are the Albemarle Pamlico National Estuary Partnership, North Carolina Division of Emergency Management, North Carolina Division of Marine Fisheries, and the North Carolina Center for Geographic Information and Analysis.
Adaptive Participatory Management
The North Carolina Coastal Atlas is taking an intentionally user-oriented approach to developing thematic maps and other content. Before developing content, a needs assessment was conducted with potential users including planners, resource managers, engineers and other interested coastal managers. Essential data categories and useful tools were identified and targeted for incorporation into the digital atlas. As these data and tools continue to be developed, usability and user needs will guide decisions and priority setting. One future direction is public participatory maps which integrate knowledge from both experts and other people living at the coast. These maps can help create a better avenue of communication and may help decision-makers gather and organize information within a shared spatial context. Better data and maps tools may facilitate better coastal hazards and natural resource planning and management for a more sustainable and resilient coast.
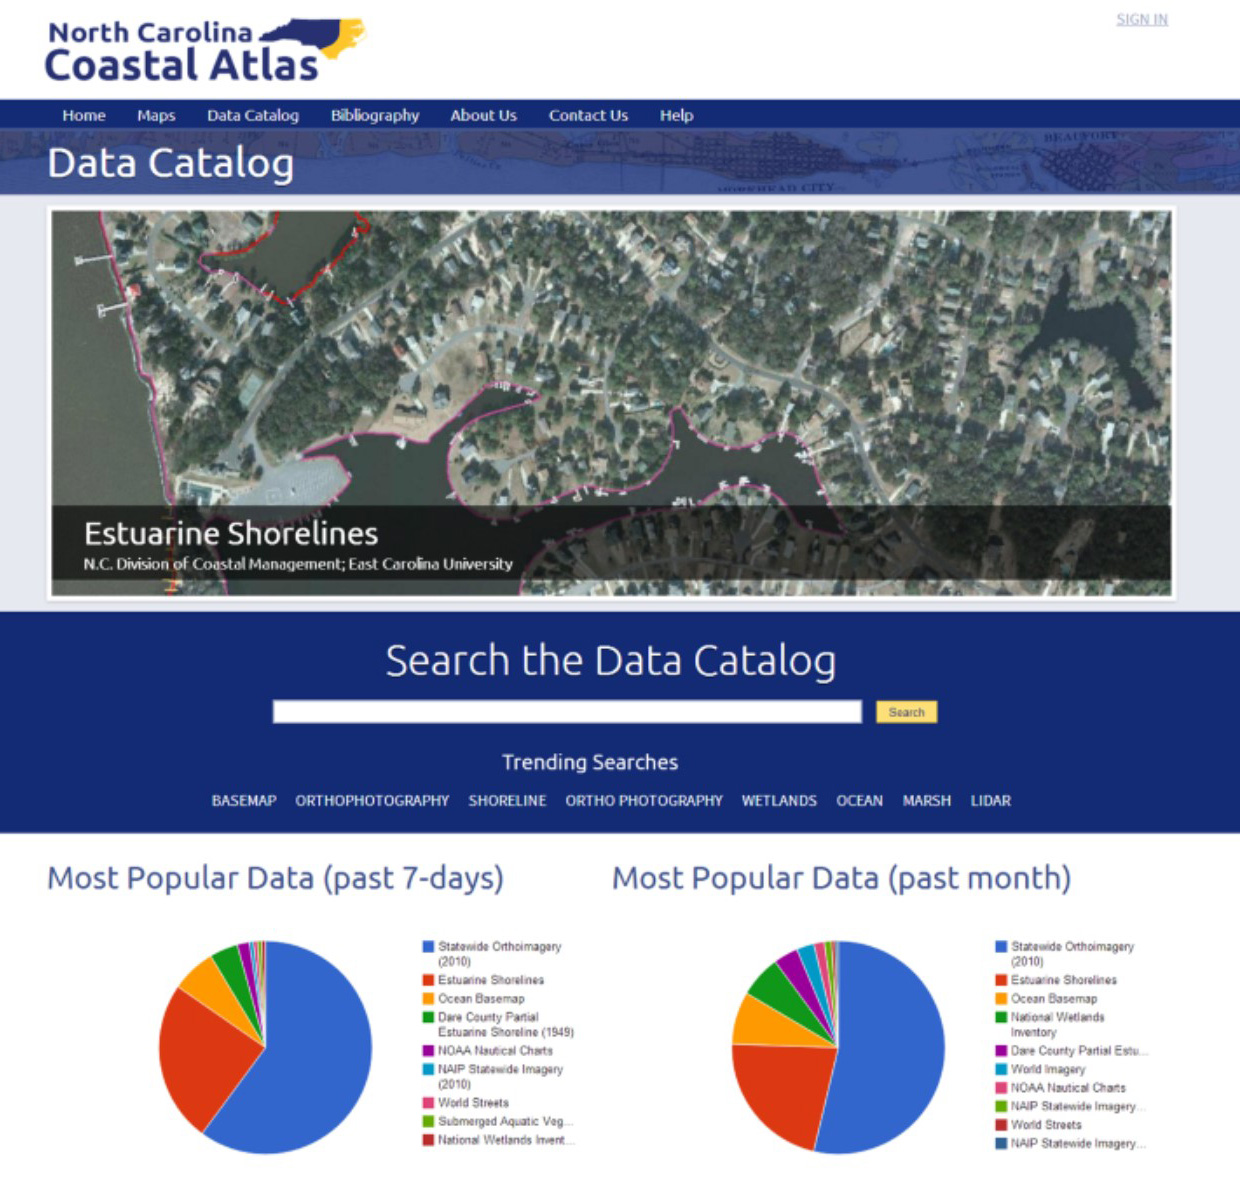
Figure 3: The Data Catalog Search window for the North Carolina Coastal Atlas showing pie diagrams of
the most popular data searched for in the past 7 days and the past month
Introducing the IODE ICAN Project Steering Group
- Detalles
- Categoría: News News
 |
 |
|
IODE ICAN Project Steering Group Co-chairs: Left: Ned Dwyer, Right: Marcia Berman |
|
IODE ICAN Steering Group Members |
|
| Marcia Berman (Co-Chair) | Virginia Institute of Marine Science, College of William and Mary, USA |
| Ned Dwyer (Co-Chair) | Coastal Marine Research Centre, University College Cork, Ireland |
| Angora Aman | ODINAfrica |
| John Bemiasa | ODINAfrica |
| Fernando Felix | SPINCAM, South America |
| Alejandro Iglesias-Campos | International Oceanographic Commission |
| Kathrin Kopke | Coastal Marine Research Centre, University College Cork, Ireland |
| Roger Longhorn | EUCC, Belgium |
| Tony LaVoi | NOAA, USA |
| Adam Leadbetter | British Oceanographic Data Centre |
| Andrus Meiner | European Environment Agency |
| Liz O’Dea | State of Washington, Department of Ecology, USA |
| Ramon Roach | Coastal Management Unit, Barbados |
| Lucy Scott | Agulhas and Somali Current Large Marine Ecosystems Project, Africa |
| Andrew Sherin | Atlantic Coastal Zone Information Steering Committee, Canada |
| Dawn Wright | ESRI |
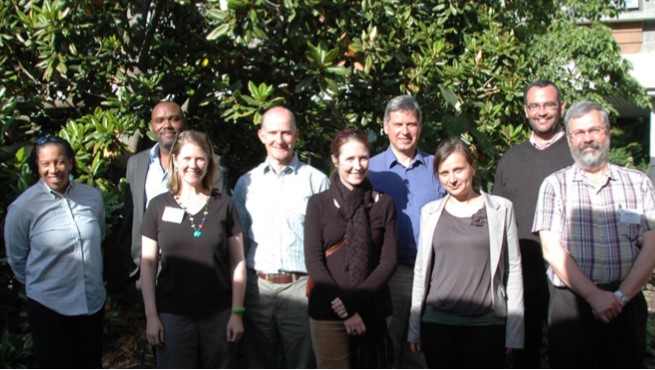 (Back row from the left) Ramon Roach, Coastal Management Unit, Barbados, Ned Dwyer (Co-Chair) Coastal Management Research Centre (CMRC), University College Cork, Ireland, Andrus Meiner, European Environment Agency, Alejandro Iglesias-Campos, International Oceanographic Commission; (Front Row from left) Dawn Wright, ESRI, Liz O’Dea, Washington State, USA, Lucy Scott, Agulhas and Somali Current Large Marine Ecosystems Project, Kathrin Kopke, CMRC, and Andy Sherin, Atlantic Coastal Zone Information Steering Committee Secretariat, Canada |
|
ICAN at CoastGIS 2013
- Detalles
- Categoría: News News
For the second time ICAN and CoastGIS were held in the same venue one meeting after the other. CoastGIS 2013, the 11th International Symposium for GIS and Computer Cartography for Coastal Zone Management was held immediately after ICAN 6 as ICAN 5 was held before CoastGIS 2011 in Ostende, Belgium.

co-founder of the CoastGIS series Darius Bartlett (third from the right)
 Many ICAN 6 participants stayed on in Victoria to contribute to the CoastGIS conference. Rosaline Canessa and Andrew Sherin, CoastGIS 2013 Co-chairs, were ICAN 6 participants. Andrew delivered three papers, and a poster and organized the workshop on “LiDAR Data Accessibility” at CoastGIS. As Adam mentioned in ICAN Technicalities, David Hart and Tanya Haddad presented a workshop entitled “Interoperable Web Services for Adaptive Coastal Management”
Dawn Wright, ICAN co-founder and Steering Group member, prepared a video keynote presentation for CoastGIS “Everyone Loves a Story, Even Policy Makers” that is viewable on the CoastGIS website http://coinatlantic.ca/index.php/program/program
Dr. Rosaline Canessa, Department of Geography, University of Victoria and Co-Chair, CoastGIS 2013
Other ICAN 6 participants that presented at CoastGIS 2103 included Andy Lanier, Robert Branton, Caroline García Valencia, Andrus Meiner, William McClintock, Julian Pizarro, Kathrin Kopke, Lucy Scott, Tanya Haddad, Todd Hallenback, Liz O’Dea, Ned Dwyer, Yassine Lassoued, Simon Claus, and Silvia Sartor.
A session on Coastal Atlases at CoastGIS 2013 included presentations on the African Coastal and Marine Atlas, the Oregon Coastal Atlas, the Washington Coastal Atlas, Tools and Best Practices for Coastal Web Maps and SmartAtlas.
ICAN 7 will be held in conjunction with CoastGIS 2015 that is planned to be held in South Africa tentatively in April 2015.
Integrated Marine Data Repository for Macaronesia -REDMIC-
- Detalles
- Categoría: News News
Juan Antonio Bermejo Domínguez,
Observatorio Ambiental Granadilla (OAG),
Edf. Puerto Ciudad, oficina 1ºB,Santa Cruz de Tenerife, Spain
e-mail: Esta dirección de correo electrónico está siendo protegida contra los robots de spam. Necesita tener JavaScript habilitado para poder verlo.
 The aim of the Integrated Marine Data Repository for Macaronesia (REDMIC) is to provide a permanent system for systematic storage, custody and service of marine data of the Canary Islands and, by extension, the Macaronesian Region (Azores, Madeira, Cape Verde & Canary Islands). The repository is configured as an open system of integrated geographic information suitable for searching, viewing, downloading, and data analysis. REDMIC is presented as database capable of covering all areas. Data, whatever their nature, are bounded by the activity that generates them and grouped by type of activity, with total freedom to define them. Using a common data model (ArcMarine) allows to develop analytical functionalities based in any data hosted, no matter their origin. This achievement will serve the research community, interested citizens, marine user-groups, local planning and management authorities and it will support as well the policy actions derived from the Habitat Directive, Water Quality Directive and Marine Strategy Directive. The Macaronesian region in the NE-Atlantic, aims to be integrated in the Marine Data Infrastructure of Europe, and supports the provisions of Directive 2007/2/EC INSPIRE. Moreover, as pilot-project, it could become an attractive operational model that can be replicated in other marine regions (Pacific, Caribbean, etc.)
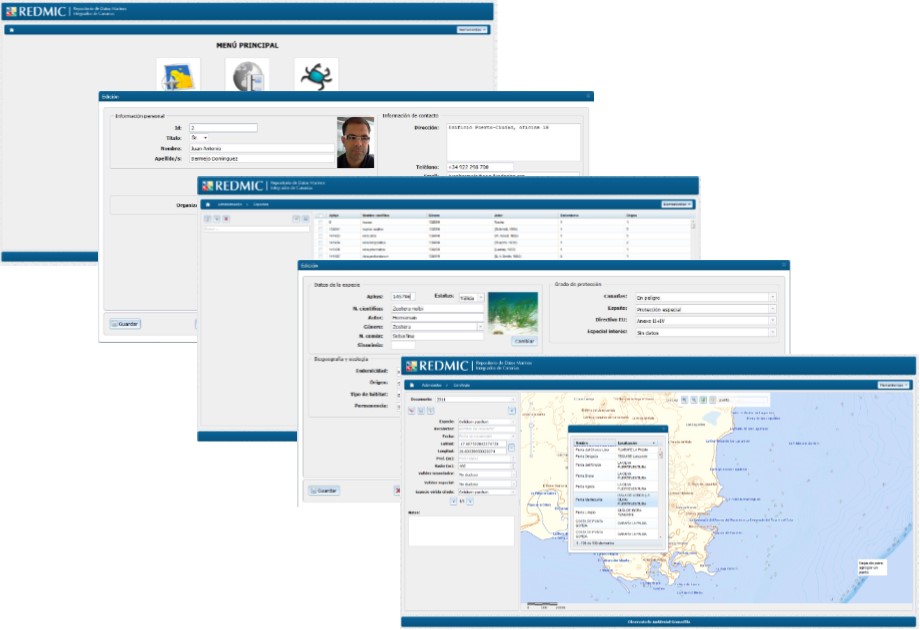
REDMIC is currently in second phase of development, centred on programming several modules and feeding data in parallel. The specific objectives at present are the following:
- To develop the software to facilitate data handling (adding, editing, transfer, user –friendly interfaces, etc.)
- To incorporate basic administrative data (protected areas, institutions, etc.) and feeding marine data for the Canary Islands and Madeira Archipelago as a continuous process.
- To establish coordination protocols between Regions in order to share and work simultaneously with REDMIC, and train technicians to run the different modules.
- To disseminate the goals, scope, and usefulness of REDMIC.
REDMIC is conceived as a perpetual service provided by the Observatorio Ambiental Granadilla (OAG) and based at its Data Center in Santa Cruz de Tenerife, Spain. It aims to eventually become an official repository for public marine data.
Module development
The OAG has already made a significant effort acquiring hardware and standard software to support the Marine Data Repository. However, in order to run the Repository in an integrated manner according to the ArcMarine conceptual framework, there is a need for considerable programming, namely, the development of specific modules that allow user-friendly incorporation of data into the system, handling metadata (institutions, platforms, sensors, parameter descriptions, etc), quality assessment procedures, etc. The following is a summary of the modules to be developed:
- Administrative module (business tables):
- Chorologic module
- Biotic surveys module
- Tracking module
- Time series & instantaneous data management module
- Taxonomic module
- Reference management module
Data types
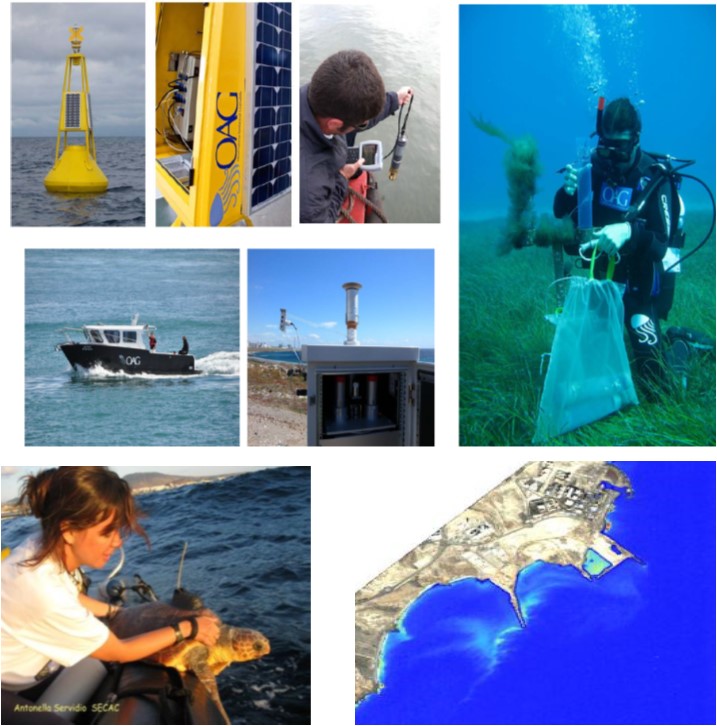 REDMIC is presented as a single database capable of covering all areas. Data, whatever their nature, is bound by the activity that generates them with total freedom to define them and are grouped by type of activity. Using a common data model allows the development of analytical functionalities with access to any data whatever activity has generated it. Data within the REDMIC can be of different natures, considering the multiple variables and environmental parameters interrelated in the marine ecosystem. A systemic analysis of data and metadata relevant to the repository is as follows:
a) Marine climatology
b) Physical oceanography
c) Chemical oceanography
d) Biodiversity
e) Archaeology
f) Environment
g) Political and administrative data
h) Infrastructure
i) Use of resources
j) Navigation and incidents
k) Images & remote sensing
ArcMarine Logical data model
REDMIC it is based on the ArcMarine data model, and client-server architecture in a distributed system, which consists of clients seeking services and a server responding to requests. To optimize the process of adding data to REDMIC, the OAG will develop an web interface software (several modules) using php and javascript. The application will works on the management system database PostgreSql and has integration with ArcGIS Server 10 for the management, analysis and maintenance of geo-referenced data. Integration with ArcGIS Server will be done through the framework developed by ESRI Web Dojo. The OAG has already developed some interface prototypes, like the chorologic module, which is ready to be used and tuned-up. We adopted web technology because it provides universal access to applications through predefined user roles, making the REDMIC ubiquitous.
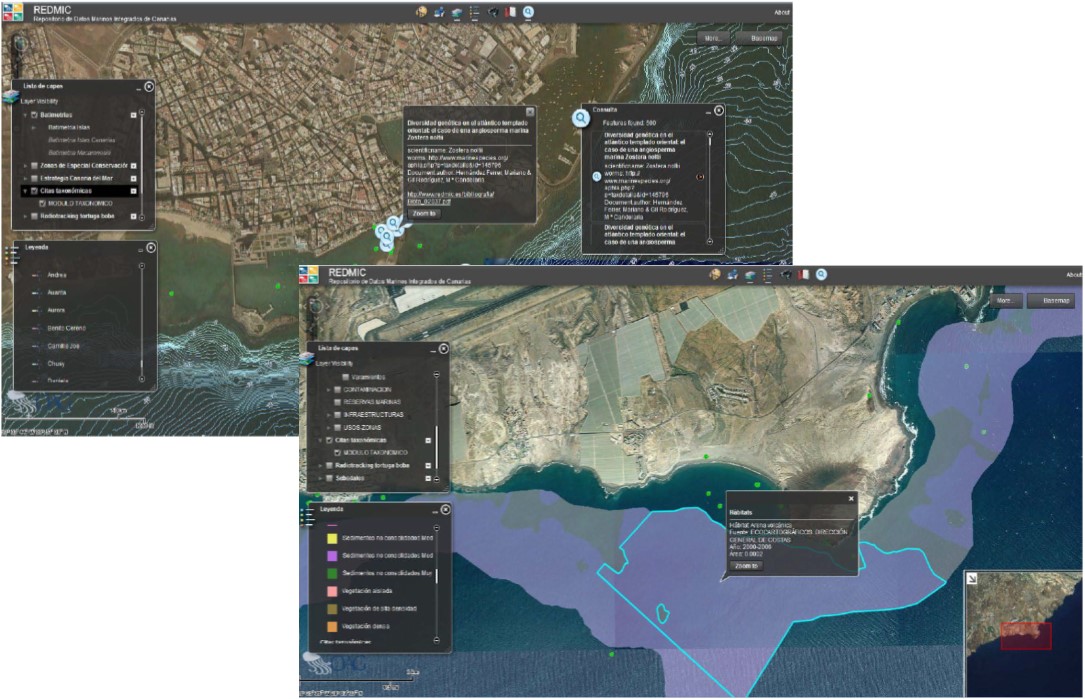
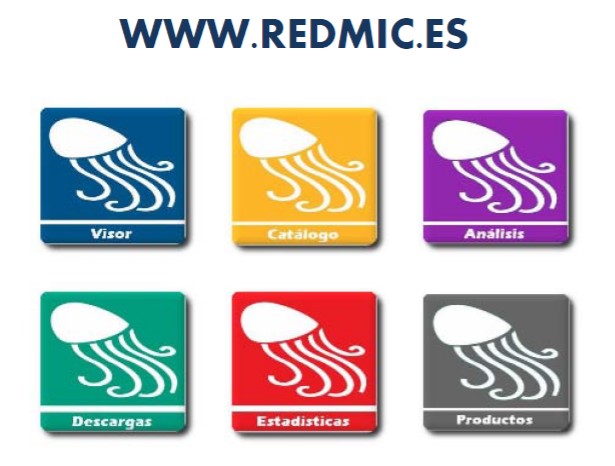
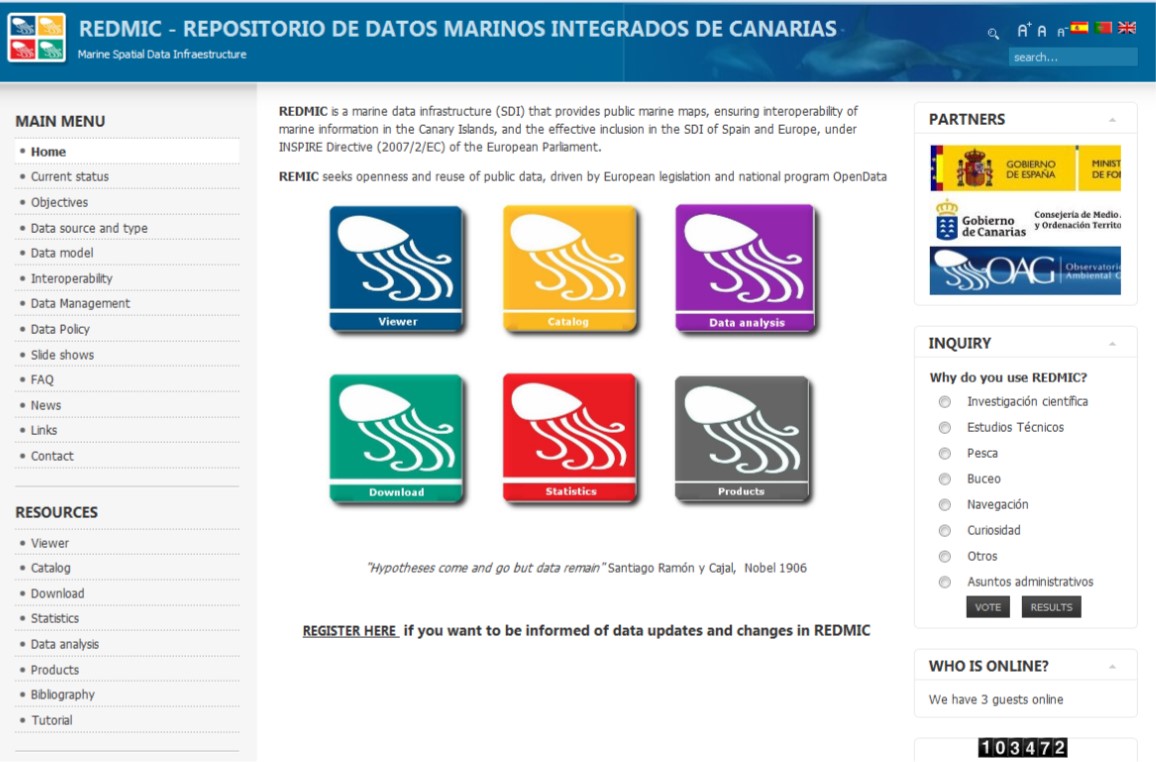
The User Geoportal
REDMIC has a website (http://www.redmic.es) which is essential to fulfilling its objectives of public access to information and data, as well as the best way of making itself well-known. The user geoportal is the initial window of access to REDMIC, showing all the possibilities offered by this service. Most of them are not yet developed, but existing information has been included to test accessibility and disseminate REDMIC existence and goals. The user can choose the "Viewer", "Downloads" or "Analysis" entry buttons, as well as the “Catalog”. Simple and intuitive searching and selecting data is common to these modules. Within the window of "Products" the user can download the result of tests carried out or some finished work of general interest. The provision of basic or developed information can be as wide as the data stored in the REDMIC allow. It is logical to concentrate on that for which there is some demand, for example:
- Sea conditions (wind, waves, temperature)
- Species distribution
- Marine protected areas
- Concentration of pollutants in coastal areas
- Whale watching areas
- Fishery regulated areas
- Distribution of sea-grass meadows
- Bathing condition maps, etc.