
The Acadia Tidal Energy Institute in partnership with Atlantic Canada Opportunities Agency, Nova Scotia Department of Energy, Offshore Energy Research Association, Fundy Ocean Research Centre for Energy (FORCE) and Tekmap Consulting are developing an interactive web map to make Nova Scotia tidal energy-related spatial information readily available to the public.
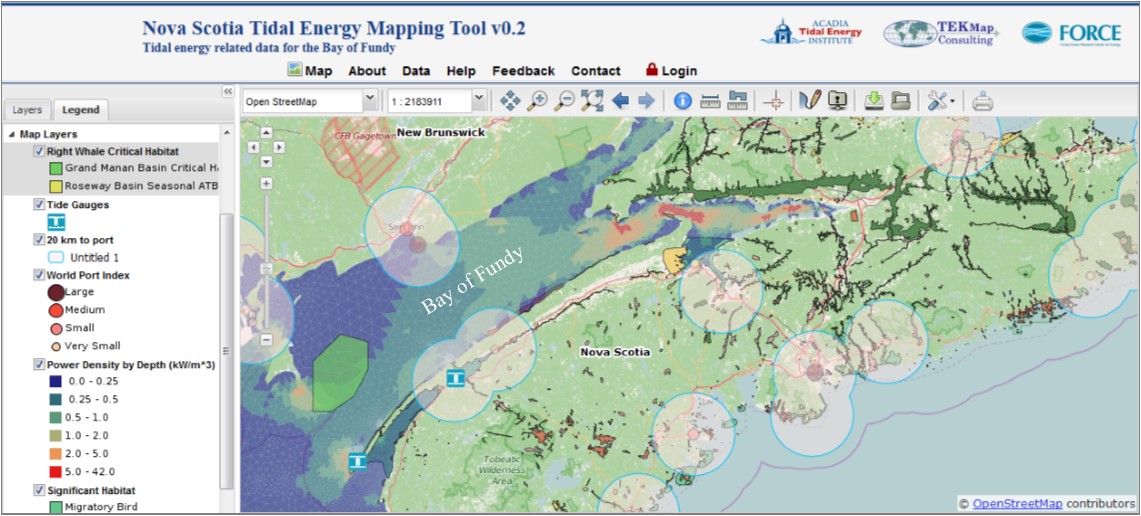
Right Whale critical habitat, 20 km buffers from ports (created with the vector buffer tool), power density and significant habitats
Introduction
Nova Scotia, Canada is home to the world’s highest tides and in six hours more water flows into the Bay of Fundy than the combined flow of all the world’s freshwater rivers. The tidal energy resources are significant here and in-stream tidal energy development is underway in several high flow locations in Nova Scotia.
Over the past decade a considerable amount of tidal energy-related spatial data has been acquired from many projects, researchers and regions. These studies support the developing industry through risk reduction and informed decision making. Much of the data available for the tidal energy industry in Nova Scotia is in the form of lengthy technical reports and large data sets housed by numerous institutions. Accessing information for technical analysis, business development and community engagement requires extensive exploration. To overcome this challenge, these otherwise disparate sets can be successfully combined, displayed and manipulated in a web-enabled platform.
Background
A proof-of-concept was developed in the spring of 2014 with seed funding from the Offshore Energy Research Association of Nova Scotia (OERA). The aim was to build a decision-making tool that integrates complex spatial information of importance to the emerging tidal energy industry while also being scalable, flexible and accessible — prudent features of a rapidly evolving industry. The platform is built on open source software and uses the industry standard for communicating spatial data. The proof-of-concept successfully integrated the high-resolution hydrodynamic modeling work of Dr. Richard Karsten and Dr. Joel Culina in the Minas Passage and Digby regions and several other layers of interest into an online map. We are now bringing this web map to a level of public readiness.
Objectives
The overall objective of this mapping project is to support an emerging industry that can bring long-term wealth and energy independence for the province while respecting the environment and other stakeholders’ needs. This project seeks to have data easily available to those who need it most: community members, decision makers, researchers, government regulators, industry developers, consultants, investors and non-profit organizations.
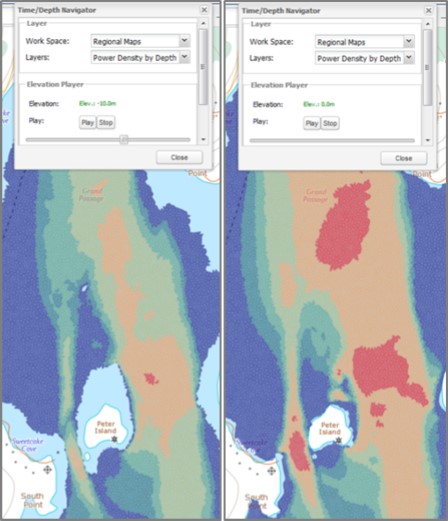
for Grand Passage, Digby Neck at a depth of 10 m (left) and 0 m, surface (right)
This tool will support advancement of an emerging industry, by avoiding duplication of efforts, identifying knowledge gaps and engaging stakeholders. Data from existing, ongoing and future research projects will be used to inform new research, education, economic development, capacity building, planning and maintenance.
Planned Outputs
The web map with tidal energy-related data and tools will be publically available in early 2016. Supplemental materials such as user guides, instructional videos and educational resources are being created to assist with accessibility and user experience.
Facilitating Data Exploration
The web map currently has standard interactive tools such as pan, zoom, measure length, measure area, print map and get feature information. In addition custom tools are being developed to enhance visualization and understanding for the user. They include:
- Vector Buffer: Create buffers around user selected layers. Useful for visualizing detection ranges for acoustic monitoring devices, determining proximity to marine protected areas, ports, substations and other important features.
- Draw Features: Draw points, lines, polygons, and labels on the map for printing and downloading.
- Vector / Raster Style Editor: Change color, name and appearance of vector layers. Customize color ramp in raster layers.
- Time / Depth Navigator: Visualize time and depth enabled layers. Useful for tidal flows, marine life detection, etc. (Figure 2).
- Score Tidal Model: Allows the user to select the model of interest and specify which hydrodynamic model metrics and values to query. Query results for the selected model appear as a new map layer (Figure 3).
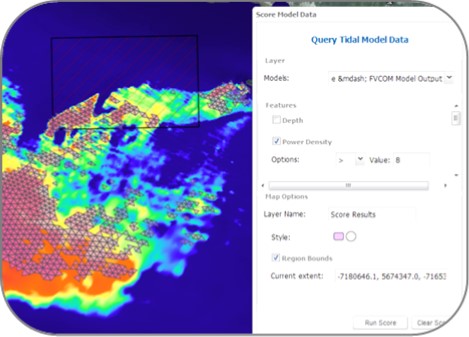
Minas Passage model where power density is greater than 8 kW/m3.
Other visible layers include the power density raster image and the FORCE Crown Lease Area (white box).
Live in 2016
The emerging tidal energy industry is advancing rapidly and will see large commercial tidal energy extraction devices deployed in the next few months at the Fundy Ocean Research Centre for Energy in the Minas Passage, and small scale turbines deployed in the Digby passages by 2017. New provincial legislation regarding commercial scale developments will soon be released to support tidal power development in Nova Scotia. By consolidating the information and data gathered for tidal energy development, and making it easily available to stakeholders over the internet, regional and site-specific knowledge can be transferred in an efficient, cost effective manner to encourage responsible development of tidal energy.
For more information on the project please visit: http://tidalenergy.acadiau.ca/ns-tidal-energy-web-map.html