by Agustín Fernández Eguiarte
The new version of the Digital Climatic Atlas of Mexico (DCAM) includes the meteorological drought thematic using advanced technological tools and new methodologies for the cartographic processes that include the quality control of the data and the display of interactive maps in the Internet.
With the aim of generate and integrate in version 2.0 of the DCAM the cartographic displays of continental basic climatic variables (temperature and precipitation), bioclimatic parameters, extreme climatology and meteorological drought periods in Mexico, the data of over 5,200 meteorological stations were processed from the daily climate databases (1902-2011) of the Mexican Weather Service (abbreviated to SMN in Spanish) of the National Commission of Water (CONAGUA). This was done as part of a joint project between the SMN and the Informatics Unit for Atmospheric and Environmental Sciences (UNIATMOS) of the Center for Atmospheric Sciences (CCA) of the National Autonomous University of Mexico (UNAM).

The drought in Mexico
The meteorological drought is an atmospheric phenomenon that occurs when the precipitation in a region, and during a determined period, is lower than the reference average established from measurements in a typical 30-year period. If the decrease of the precipitation is severe and goes on for extended periods, then the type of drought that impacts agriculture and hydrology is generated, which is characterized by the negative effects on the economic sector of the region or directly to people in the affected communities. The drought in Mexico is one of the natural phenomena that more severely affects the economy, since large cultivated areas and livestock are lost when it happens.
The main cause of the drought is the lack of rain; however, there are factors that contribute to generate it such as changes of the general circulation of the ocean-atmosphere system related to alterations in the sea surface temperature, to changes in the atmospheric pressure and to increases in the carbon dioxide concentrations, among others. The Drought Fascicle by García F., Fuentes O. y Matías L. G., (2002), published by the National Center for Disaster Prevention (CENAPRED) of the Mexican Government, incorporates a historic review of the droughts that occurred in Mexico, including the months and places where it happened. The drought periods which are registered and documented in this publication are: 1998-2000, 1993-1996, 1970-1978, 1960-1964 and 1948-1954.

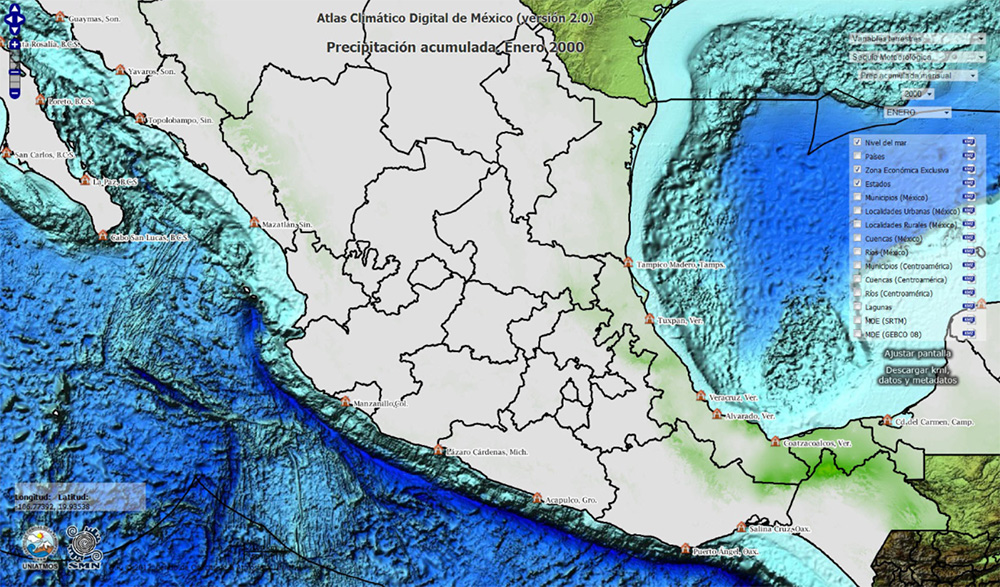
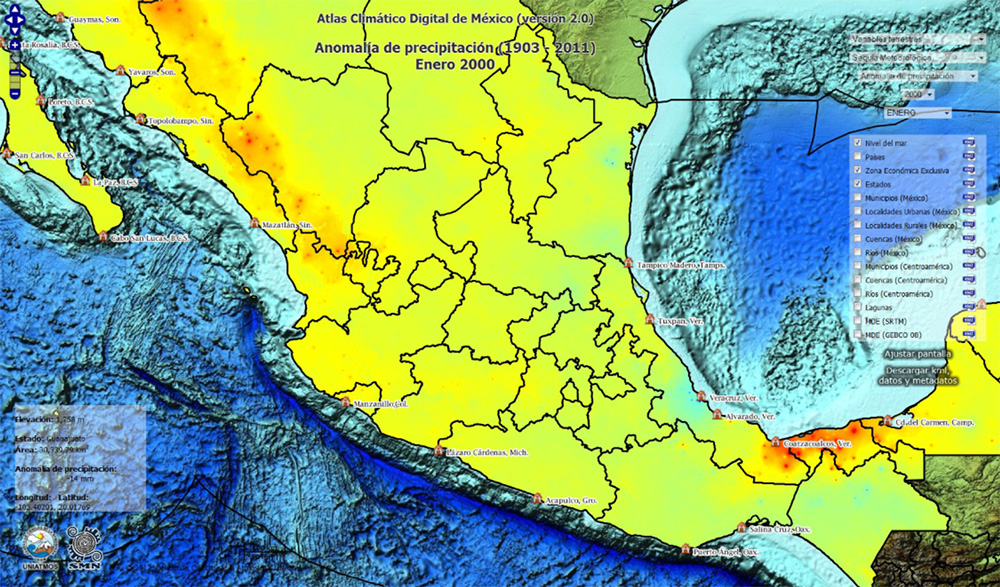
From the daily climatic data base of the SMN, that includes information for the period 1902-2011, and according to the methodology described in the DCAM documents (http://atlasclimatico.unam.mx/atlas/uniatmos.html) on the processing of climatic surface maps, and the quality control of the continental climatic information and its validation, the monthly accumulated precipitation (see figure 1) was calculated for the Mexican Republic corresponding to the months impacted by drought that are reported in the above mentioned publication, as well as its respective anomaly, which is the difference between the accumulated precipitation during a given month, for example, January 2000, and the average accumulated precipitation of all the Januaries of the period 1902-2011 (see figure 2).
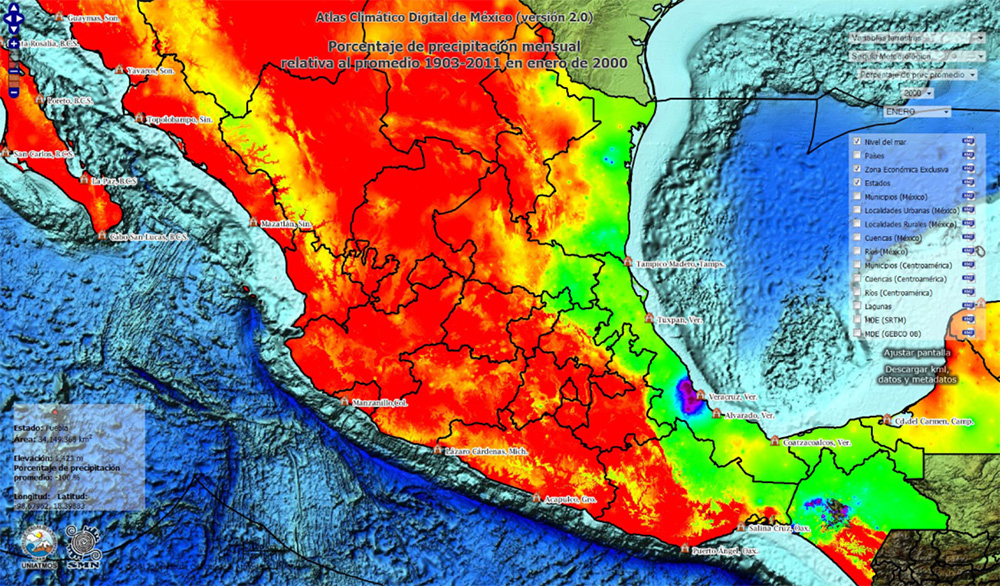
Afterwards, the obtained anomaly was normalized and a monthly map of the percentage of accumulated precipitation with respect to the average of the reference period 1902-2011 was created (see figure 3). In this map, it is possible to consult the rain percentage that have occurred above (positive) or below (negative) the historic average in any location, so that the meteorological drought may be visualized, quantified and evaluated in all the states and municipalities of Mexico.
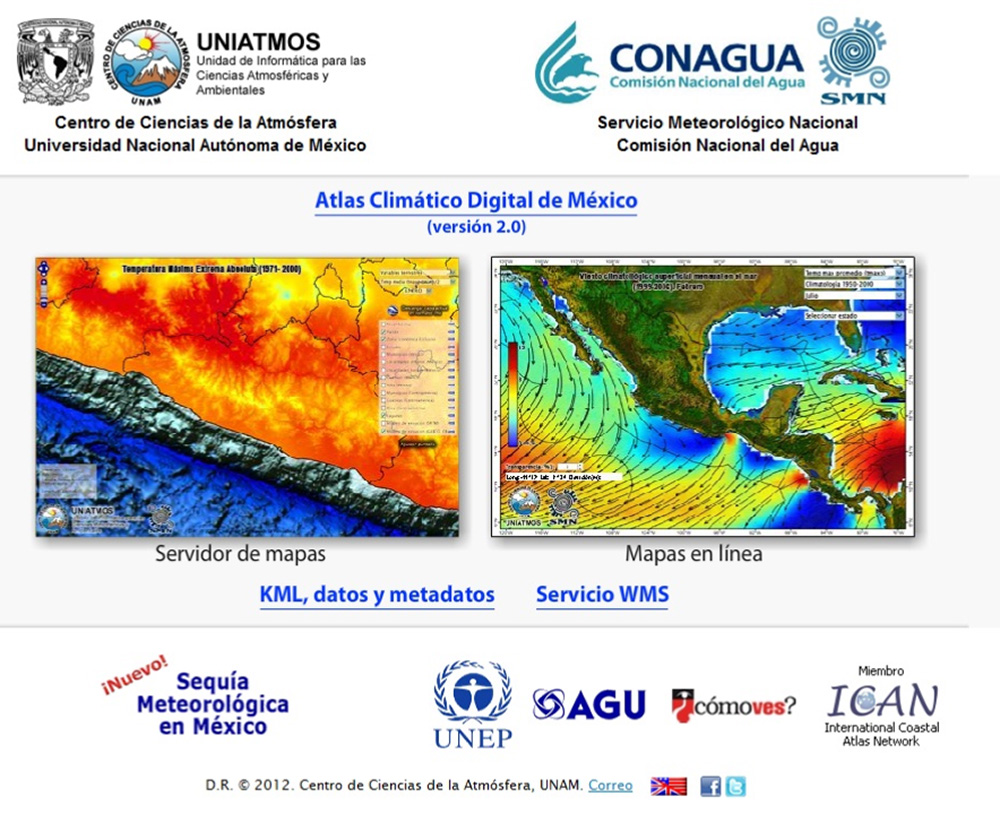
Currently, there are 213 maps of meteorological drought processed. These maps were generated at a very high spatial resolution (926 m), taking into account the topographic effect. The information is available through the “Map server”, “Maps online”, “KML, data and metadata” and “WMS Service” options of the DCAM (see figure 4). (http://uniatmos.atmosfera.unam.mx).
Marine, coastal and continental climatology
The DCAM provides users with inter-institutional information on climate, extreme climatology, climate change, droughts and bioclimatic parameters for the continental zone; also, sea surface temperature, chlorophyll-a concentration, climatological surface winds, absolute dynamic topography, sea level anomaly and geostrophic velocity over the ocean, as well as sea level in the coastal zone.
Additionally, the DCAM is a platform that allows to display and visualize the maps in an interactive mode, and offers decision-makers the quantitative elements to submit proposals that contribute to design new policies towards the reduction of vulnerability and the increase of adaptation capabilities to face the climate change and disasters linked to natural hazards in different geographic regions, as well as in the costal, agricultural and hydraulic sectors.

The “Map Server” component of the DCAM allows the visualization of thematic maps with different approaches. Specific information may be requested regarding the cartographic compositions displayed, and it is even possible to combine the thematic display of any map with reference information such as municipal, state and national boundaries, as well as hydrologic basins, rivers and lakes of Mexico and Central America. Urban and rural localities, as well as the Exclusive Economic Zone of Mexico and the countries located in the geographic area covered by the Atlas may also be incorporated. The Digital Elevation Models Shuttle Radar Topography Mission (SRTM) and General Bathymetric Chart of the Oceans (GEBCO) serve as topographic and bathymetric base for the above process.

The “Maps online” option allows a faster visualization of integrated maps and also to obtaining climatic information in any geographic location, to compare thematic layers in a clear and quick way, and to do transparencies of the thematic layers with the topography, which, in this case, comes from data of the Advanced Spaceborne Thermal Emission and Reflection Radiometer (ASTER).
The maps of the DCAM may be consulted in KML (Keyhole Markup Language) format, to be displayed and complemented with all facilities of the Google Earth system. Also, the data and metadata of the thematic maps may be downloaded freely and at no cost. Finally, the maps can also be accessed through the “WMS Service” (Web Map Service).
