
Scotland's Marine Atlas Joins ICAN
- Details
- Published: 01 September 2012 01 September 2012
Martyn Cox,
Marine Planning and Policy, Marine Scotland
This email address is being protected from spambots. You need JavaScript enabled to view it.
Introduction
Scotland is developing marine planning to provide integrated management of the Scottish marine environment and to manage the activities that take place there. The Marine (Scotland) Act 2010 introduces this and also requires an evidence base to be developed to support the development of our first National Marine Plan.
A tool for marine planning and an assessment of the seas Scotland’s Marine Atlas, published in March 2011 (hard copy, HTML and pdf) is that “Information for the National Marine Plan”. It is also an assessment of the condition of Scotland's seas, which is based on scientific evidence from data and analysis, supported by expert judgement.
The Atlas is an innovative publication which, for the first time, brings together and maps a huge range of information about Scotland’s seas. It takes on a coffee table atlas approach with spreads of information. The contents range from temperature, salinity and ocean acidification to habitats and species, from the value of fish landed to biotoxin monitoring and potential sites for marine renewables. The information is presented in a colourful and easily accessible way, with signposts to further information, and centres around maps to provide a spatial dimension.
Figure 1: Cover of Scotland's Marine Atlas
A collaborative effort
The Atlas was a significant collaboration between Marine Scotland, Scottish Natural Heritage, Scottish Environment Protection Agency, the Joint Nature Conservation Committee and the Marine Alliance for Science and Technology for Scotland. This collaboration ensured that all appropriate data collected by government and its agencies were included and allowed each section to be authored by the most appropriate expert. Material from over 100 authors was reviewed by non-Scottish bodies.
The data source and reference Annexes demonstrate the breadth of information used to present this comprehensive report (including non-Government bodies such as the Marine Conservation Society, Keep Scotland Beautiful and the Royal Yachting Association).
Presentation of the data
The data are categorised against the elements of the Scottish Government’s vision for the seas – clean and safe (hazardous substances, biological effects, eutrophication etc); healthy and biologically diverse (protected areas, species and habitats, etc); and productive (full range of economic activities). In addition there are more general sections on physical characteristics (waves, tides etc) and climate change. In this way, the Atlas provides a valuable report on the current state of the marine environment, the main pressures and impacts upon it and the value the seas provide to the national economy. As many data sets as possible are mapped based and presented with graphs around for them for ease of making spatially aware conclusions.
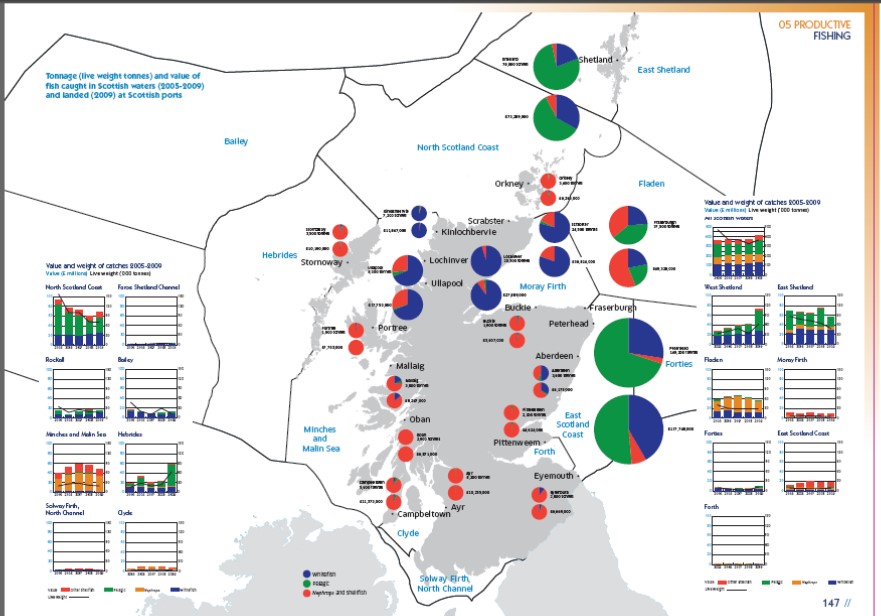
Figure 2: Fishing “spread” showing catches per sea area (graphs) and landings (pie charts)
Developing a web based version
A web-based GIS version is now under development to provide interactive maps and downloadable data sets based on those in the Atlas. At this stage the exact requirement for marine planning both in terms of data sets and its presentation are not known. We are taking an evolutionary approach by starting with making the Atlas available in a simple interactive tool and then asking stakeholders what more is required for marine planning at both the national and regional levels.
The National Marine Plan interactive (NMPi) http://www.scotland.gov.uk/Topics/marine/seamanagement/nmpihome version of the Atlas will have two key aims – to underpin the new statutory system of marine planning (nationally and regionally) and to educate and inform the wider public. To do this, it will bring together the large range of evidence used in the Atlas on-line for the first time. This includes data which are already relatively accessible (e.g. monitoring data required to report against European Directives) and other data, some of which have been commissioned specifically or analysed differently.
Where possible, data are presented at both a national and a regional scale, to aid planning at both these levels. Presenting data this way also creates challenges since many data sets have long established ways of being presented. Marine planning requirements will question the way some things are done.
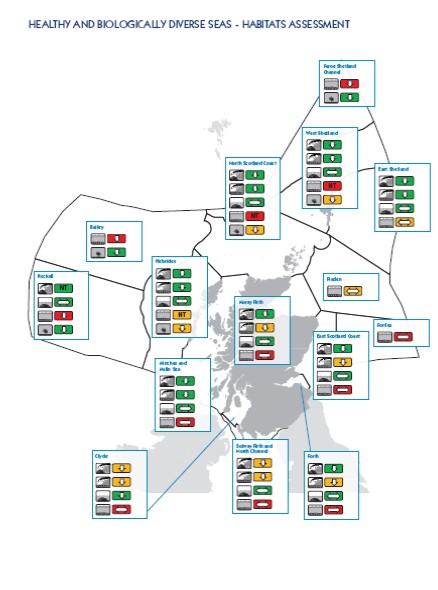
Figure 3: The habitats assessment part of the overall assessment highlighting the traffic light approach to assessing the habitats
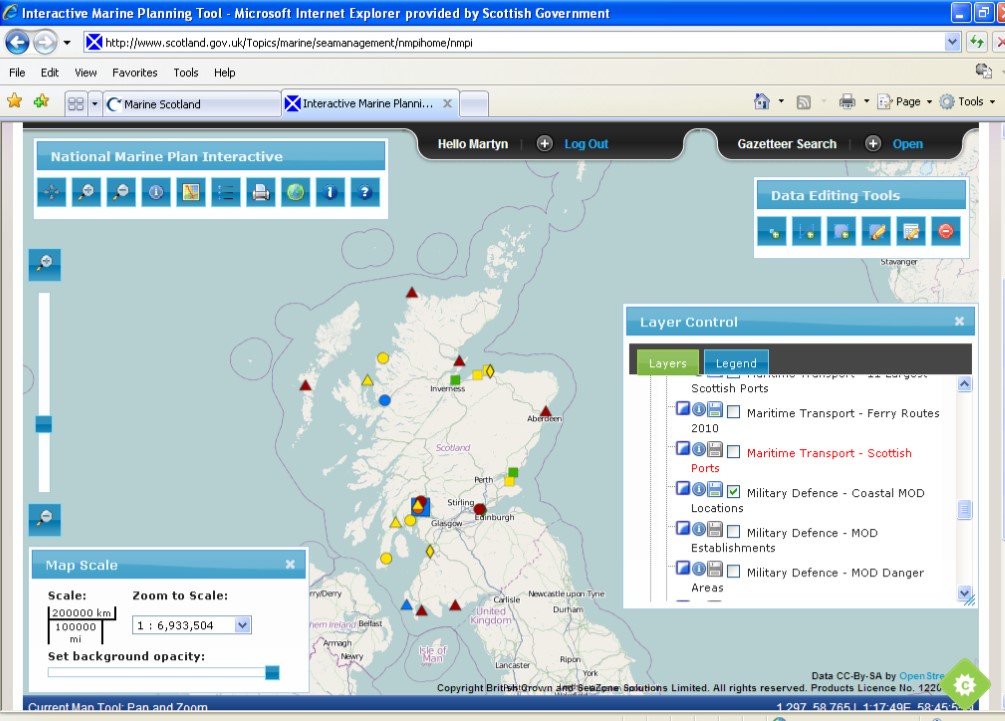
Figure 4: Screen shot of the developing national marine plan interactive
Challenges ahead
There will be many challenges ahead. The full breadth of requirement for marine planning is not known and the spatial tool will have to evolve. In doing this there will be many, no doubt competing, demands. In a time of government financial restraint the system will evolve as we establish what is required and what can be afforded.
Accessing data still remains an issue, not all sets can be openly shared without restriction yet, as does keeping any data sets up-to-date. The rapid rate of technological change will no doubt create a challenge as the possibilities are ever increasing. What we do know is that we need to do this: we have a legislative requirement and stakeholder expectations to meet.