
An on-line mapping tool for marine planning in Scotland
- Details
- Published: 29 September 2013 29 September 2013
Martyn Cox
Marine Planning and Policy, Marine Scotland
This email address is being protected from spambots. You need JavaScript enabled to view it.
Introduction
My article in the September 2012 issue of the ICAN Newsletter about “Scotland’s Marine Atlas” briefly introduced our on-line GIS tool, National Marine Plan interactive (NMPi) that was under development. NMPi has now reached the stage where it is supporting our public consultation exercise for Scotland’s first national marine plan.
Background
The Marine (Scotland) Act 2010 and UK Marine and Coastal Access Act 2009 empower Marine Scotland to deliver marine planning for Scotland’s seas on behalf of Scottish Ministers. This will assist in delivering the government’s vision of “clean, healthy, safe, productive, biologically diverse marine and coastal environments managed to meet the long term needs of nature and people”.
Scotland’s first national marine plan is under development: consultation started in July 2013. At the same time, consultation started on designating marine protected areas and identifying areas for marine renewable energy. Being able to map all these activities and proposals is important as we engage with stakeholders. Scotland’s Marine Atlas, published in 2011 was the “Information for the National Marine Plan”. Marine planning requires a significant and robust evidence base as many other coastal atlases have demonstrated. NMPi is Marine Scotland’s key tool for sharing the data with stakeholders and is complemented by Marine Scotland interactive.
renewables areas (wind, wave and tidal) and sailing routes.
What is NMPi?
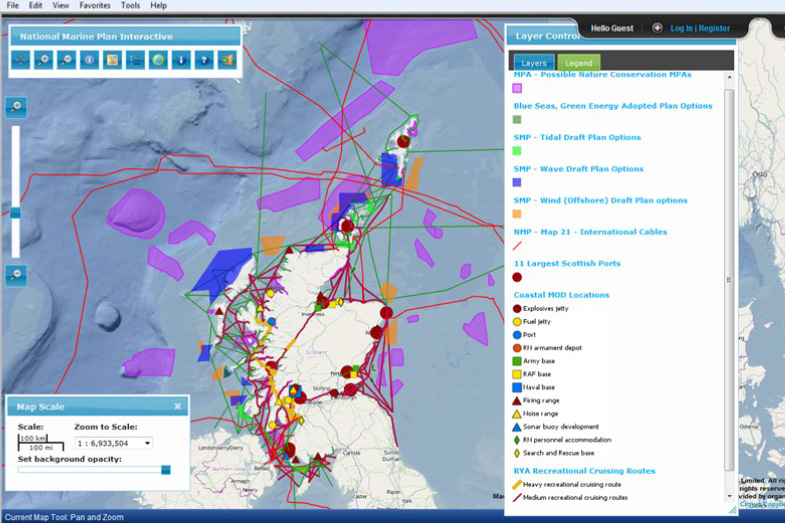
NMPi is an online, interactive GIS-based tool (using GeoServer and Open Layers software) allowing you to view different types of information (as map layers) at a scale of your choice. You can find it at: http://www.scotland.gov.uk/Topics/marine/seamanagement/nmpihome
On web pages associated with each layer, additional information is provided. This includes links to related parts of the Atlas, data sources, links to other sources of information and, where appropriate, downloadable spread sheets to update the Atlas graphs.
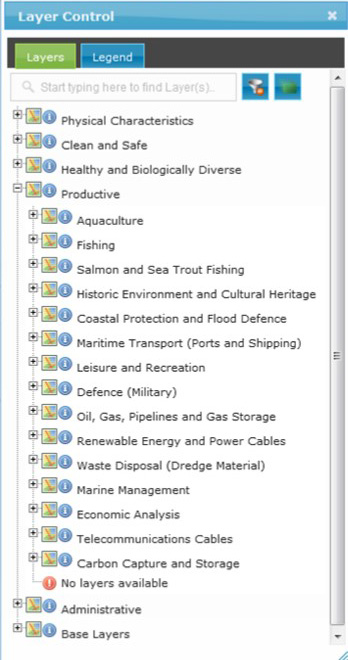
Data are presented in layers and grouped into the various aspects of the Government’s vision for the seas - clean and safe seas; healthy and biologically diverse seas; productive seas; as well as background layers on physical characteristics and administrative boundaries.
All users have access to:
- Data display - geographic information through a web-map interface, with a map canvas, a switchable list of layers, and various tools.
- Links to associated web pages with additional information.
- NMPi’s “web map services” using client software (e.g. a desktop GIS package) – a requirement of the INSPIRE directive.
- A dedicated version for browsers on mobile devices (SmartPhones and iPADs).
- Registered users (free to do so) can access additional functionality:
- Create maps for printing.
- Develop their own data layers (which can then be submitted to Marine Scotland).
- Download certain data (subject to a licence agreement).
New content is being added to NMPi on an on-going basis, while existing content is also being updated.
Collaborative working
Marine Scotland is again working closely with its Atlas partners Scottish Natural Heritage, Joint Nature Conservation Committee, Scottish Environment Protection Agency and the Marine Alliance for Science and Technology Scotland in keeping data sets updated on NMPi.
Experiences to share
Marine planning requires many data sets to be effective but they are not all collected either by Marine Scotland (MS) or its’ collaborative partners. So MS spends time acquiring data from others (paying for some commercial data sets) so that data can be displayed. The attributes may also have to be limited if there is information of commercial value or a confidential nature. NMPi is designed so that spatial data can be downloaded via a click licence but given the nature and breadth of NMPi’s data, the download function is restricted to MS data with signposting to 3rd party web sites for their data.
Summary
There are currently in excess of 200 layers and this looks set to expand. Developing a system that covers such a range of activities is both challenging and rewarding, as I am sure other ICAN members will agree. The technology we have available today is very powerful whilst at the same time we need to respect intellectual property rights and sensitivities about data, amongst others. There is a much to take into account when making information publicly available. NMPi is the next stage in Marine Scotland’s innovations. It follows the successful Atlas and the later e-publication (for iPads and Kindles etc.).
NMPi is an innovative tool to assist Marine Scotland in its delivery of marine planning. It will support policy making as use of the seas changes, whether that is for sustainable economic growth through a variety of human activities or conservation through the designation of marine protected areas. I am sure NMPi will evolve as needs require. As a member of ICAN we look forward to sharing what we are doing and learning from others in the network.